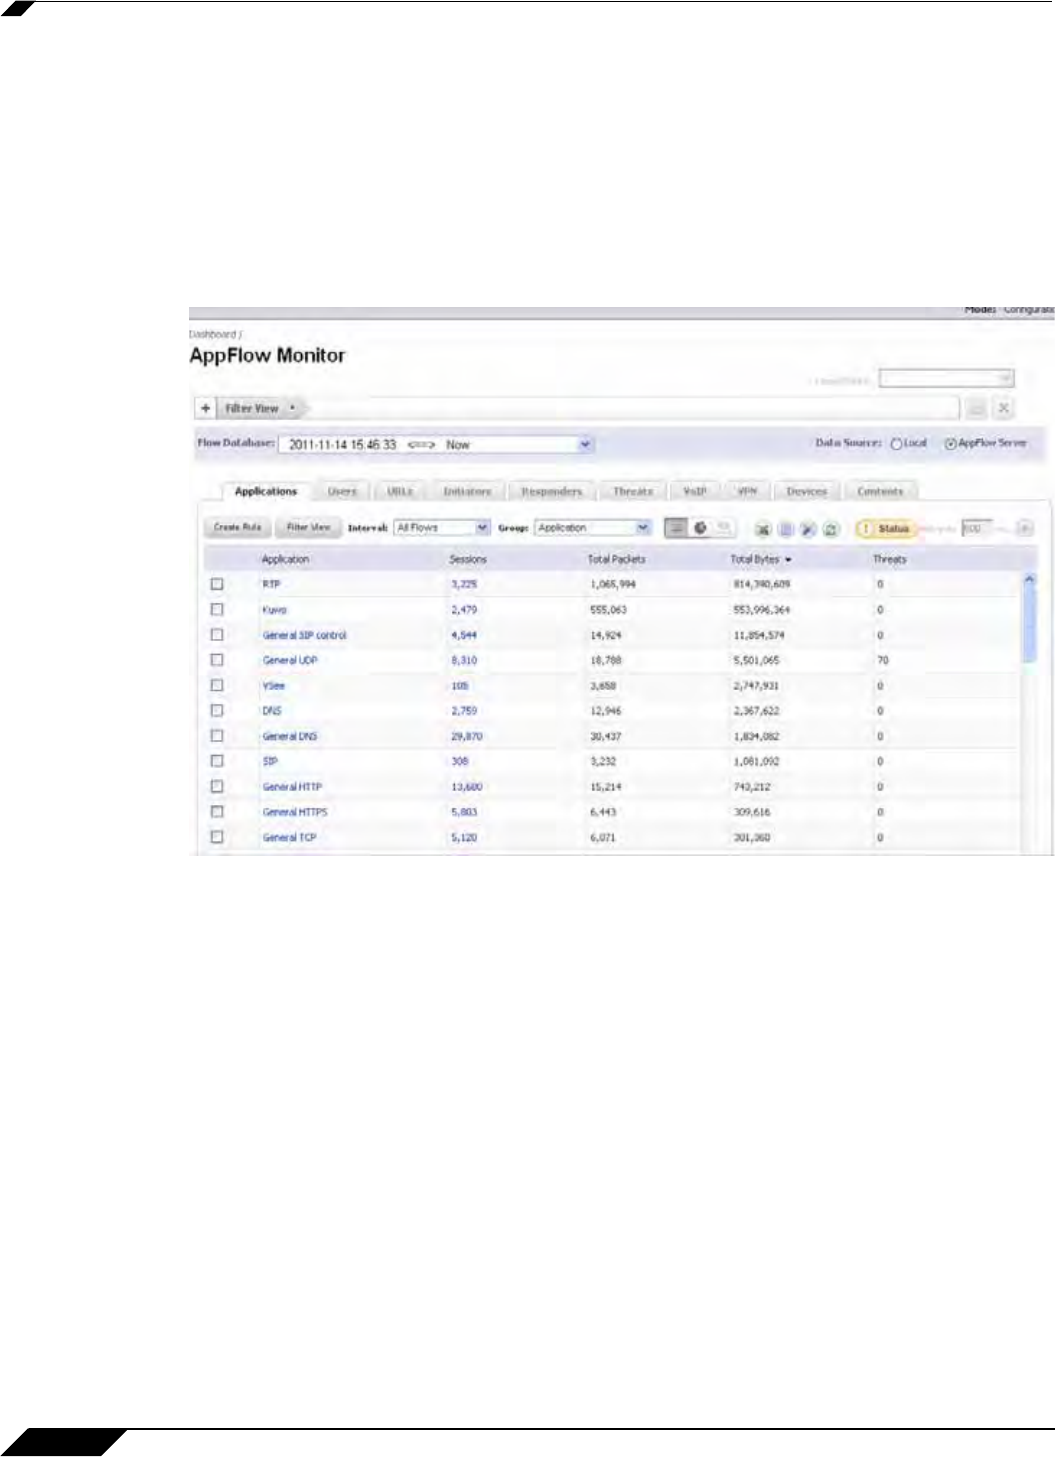
Dashboard > AppFlow Monitor
76
SonicOS 5.8.1 Administrator Guide
AppFlow Monitor Views
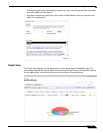
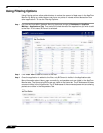
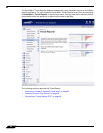
Three views are available for the AppFlow Monitor: Detailed, Pie Chart, and Flow Chart View.
Each view provides the administrator a unique display of incoming, real-time data.
List View
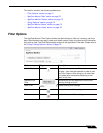
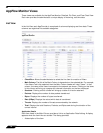
In the List View, each AppFlow tab is comprised of columns displaying real-time data. These
columns are organized into sortable categories.
• Check Box: Allows the administrator to select the line item for creation of filters.
• Main Column: The title of the Main Column is dependent on the selected tab. For example,
if the Users Tab is the selected, then the Main Column header will read “Users”. In that
column, the name of the Users connected to the network are shown. Clicking on the items
in this column will bring up a popup with relevant information on the item displayed.
• Sessions: Clicking on this number will bring up a table of all active sessions.
• Packets: Displays the number of data packets transferred.
• Bytes: Displays the number of bytes transferred.
• Rate (KBps): Displays the rate at which data is transferred.
• Threats: Displays the number of threats encountered by the network.
• Total: Displays the total Sessions, Packets, and Bytes sent during the duration of the
current interval.
Application Details
Each item listed in the Main Column provides a link to an Application Detail dialog. A display
appears when the item links are clicked. The dialog provides:
• A description of the item.


