User Management
1103
SonicOS 5.8.1 Administrator Guide
Using the Single Sign-On Statistics in the TSR
A rich set of SSO performance and error statistics is included in the trouble shooting report
(TSR). These can be used to gauge how well SSO is performing in your installation. Download
the TSR on the System > Diagnostics page and search for the title “SSO operation statistics”.
The following are the counters to look at in particular:
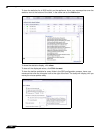
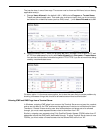
1. Under Users currently connected, the TSR can include a list of all currently logged in local
and remote users, regardless of how they were authenticated. By selecting the Current
Users and Detail of Users options on the System > Diagnostics page before generating
the TSR, eight to nine lines of detailed information are provided in the TSR for each user.
Or, you can opt for just one summary line per user by selecting Current Users and clearing
Detail of Users. If the Current Users checkbox is not selected, then the users list is
omitted from the TSR.
When Det
ail of Users is selected, numerous details are provided, varying with the type of
user. They include timers, privileges, management mode if managing, group memberships,
CFS policies, VPN client networks, and other information. Disabling this option when there
are thousands of users logged in could greatly decrease the size of the TSR file that is
created, versus one that includes the detailed users list.
When De
tail of Users is not selected, the user summary includes the IP address, user
name, type of user and, for administrative users who are currently managing, their
management mode. For example:
Users currently connected:
192.168.168.1: Web user admin logged in (managing in Config mode)
192.168.168.9: Auto user Administrator (SD80\Administrator) auto logged in
2. Under SSO ring buffer statistics, look at Ring buffer overflows and Maximum time
spent on ring. If the latter approaches or exceeds the polling rate, or if any ring buffer
overflows are shown, then requests are not being sent to the agent quickly enough. Also,
if the Current requests waiting on ring is constantly increasing, that would indicate the
same. This means that the Maximum requests to send at a time value should be
increased to send requests faster. However, that will increase the load on the agent, and if
the agent cannot handle the additional load, then problems will result, in which case it may
be necessary to consider moving the agent to a more powerful PC or adding additional
agents.
3. Under SSO operation statistics, look at Failed user id attempts with time outs and
Failed user id attempts with other errors. These should be zero or close to it – significant
failures shown here indicate a problem with the agent, possibly because it cannot keep up
with the number of user authentications being attempted.
4. Also under SSO operation statistics, look at the Total users polled in periodic polling,
User polling failures with time outs, and User polling failures with other errors. Seeing
some timeouts and errors here is acceptable and probably to be expected, and occasional
polling failures will not cause problems. However, the error rate should be low (an error rate
of about 0.1% or less should be acceptable). Again, a high failure rate here would indicate
a problem with the agent, as above.
5. Under SSO agent statistics, look at the Avg user ID request time and Avg poll per-user
resp time. These should be in the region of a few seconds or less – something longer
indicates possible problems on the network. Note, however, that errors caused by
attempting to authenticate traffic from non-Windows PCs via SSO (which can take a
significantly long time) can skew the Avg user ID request time value, so if this is high but
Avg poll per-user resp time looks correct, that would indicate the agent is probably
experiencing large numbers of errors, likely due to attempting to authenticate non-Windows
devices – see below, #7.


