57
SonicOS 5.8.1 Administrator Guide
CHAPTER 4
Chapter 4: Using the SonicOS Visualization
Dashboard
Visualization Dashboard
The SonicWALL Visualization Dashboard offers administrators an effective and efficient
interface to visually monitor their network in real time, providing effective flow charts of real-
time data, customizable rules, and flexible interface settings. With the Visualization Dashboard,
administrators can efficiently view and sort real-time network and bandwidth data in order to:
• Identify applications and websites with high bandwidth demands
• View application usage on a per-user basis
• Anticipate attacks and threats encountered by the network
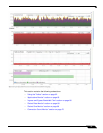
This document contains the following sections:
• “Enabling the Real-Time Monitor and AppFlow Collection” section on page 58
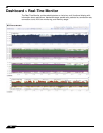
• “Dashboard > Real-Time Monitor” section on page 60
• “Dashboard > AppFlow Monitor” section on page 70
• “Dashboard > Threat Reports” section on page 79
• “Dashboard > User Monitor” section on page 84
• “Dashboard > BWM Monitor” section on page 85
• “Dashboard > Connections Monitor” section on page 85
• “Dashboard > Packet Monitor” section on page 87
• “Dashboard > Log Monitor” section on page 91


