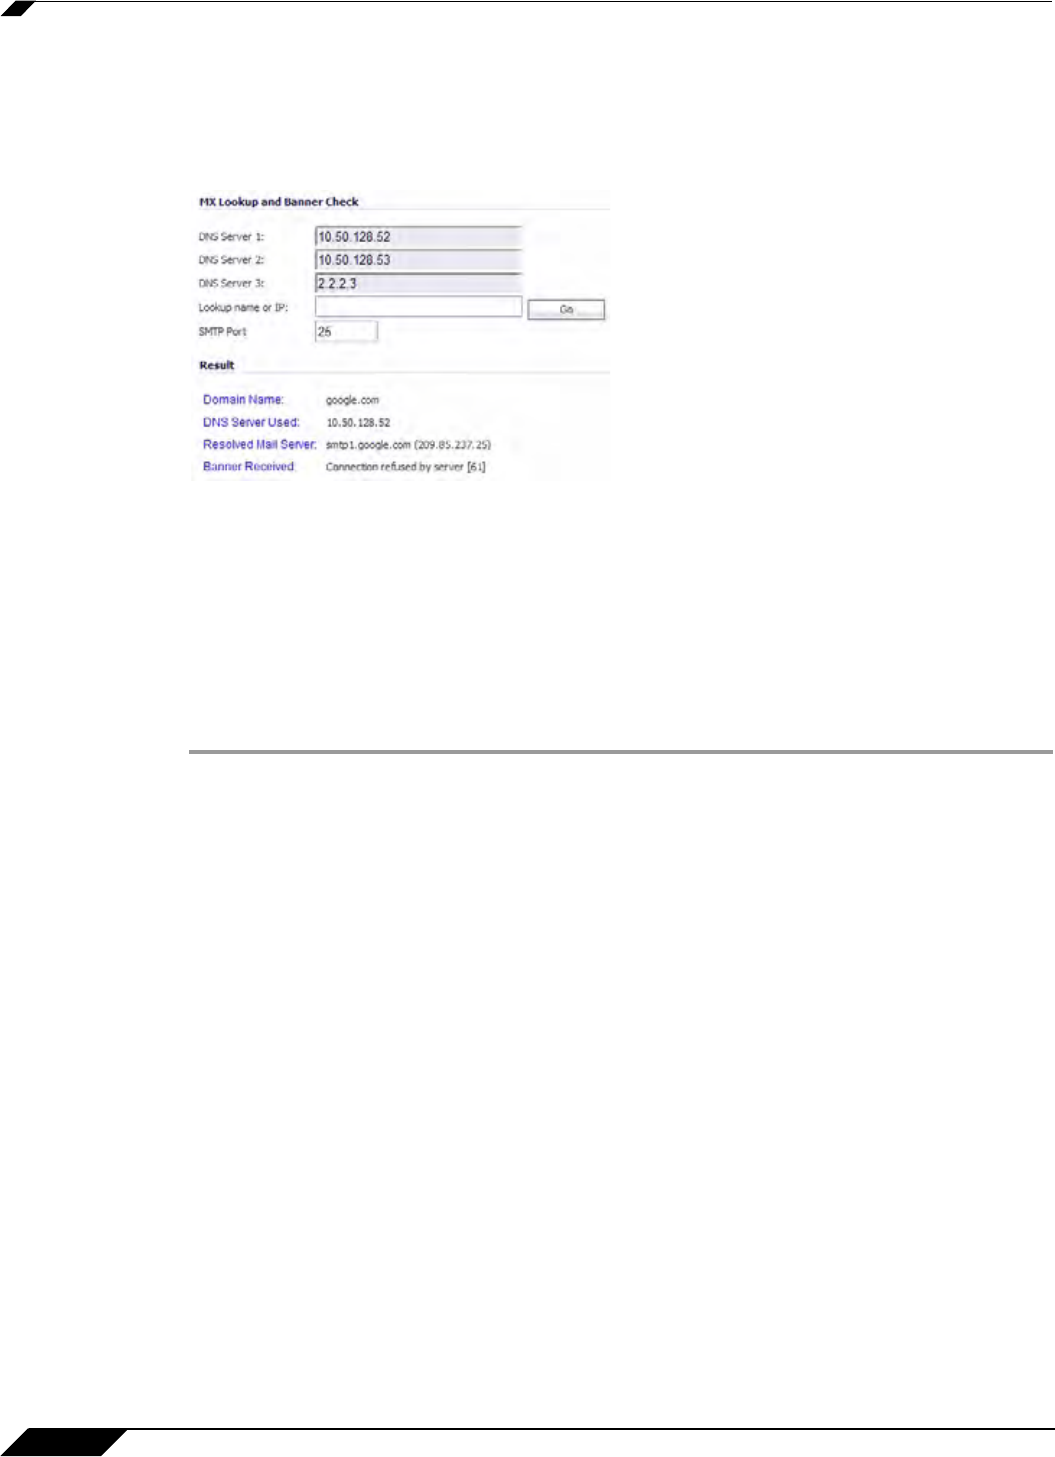
System > Diagnostics
178
SonicOS 5.8.1 Administrator Guide
the output is displayed under Result. The results include the domain name or IP address that
you entered, the DNS server from your list that was used, the resolved email server domain
name and/or IP address, and the banner received from the domain server or a message that
the connection was refused. The contents of the banner depends on the server you are looking
up.
Trace Route
Trace Route is a diagnostic utility to assist in diagnosing and troubleshooting router
connections on the Internet. By using Internet Connect Message Protocol (ICMP) echo packets
similar to Ping packets, Trace Route can test interconnectivity with routers and other hosts that
are farther and farther along the network path until the connection fails or until the remote host
responds.
Step 1 Select Trace Route from the Diagnostic Tool menu.
Step 2 Type the IP address or domain name of the destination host in the TraceRoute this host or IP
addres field.
Step 3 In the Interface pulldown menu, select which interface you want to test the trace route from.
Selecting ANY allows the appliance to choose among all interfaces—including those not listed
in the pulldown menu.
Step 4 Click Go.
A second window is displayed with each hop to the
destination host. By following the route, you
can diagnose where the connection fails between the SonicWALL security appliance and the
destination.
Web Server Monitor
The Web Server Monitor tool displays the CPU utilization of the Web server over several
periods of time. The time frame of the Web Server Monitor can be changed by selecting one of
the following options in the View Style pulldown menu: last 30 seconds, last 30 minutes, last
24 hours, or last 30 days.
