SonicPoint > RF Analysis
593
SonicOS 5.8.1 Administrator Guide
Channel Utilization Graphs and Information
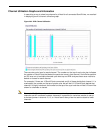
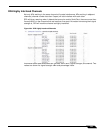
In searching a way to show how channel is utilized for all connected SonicPoints, we resulted
in displaying such a channel utilization graph.
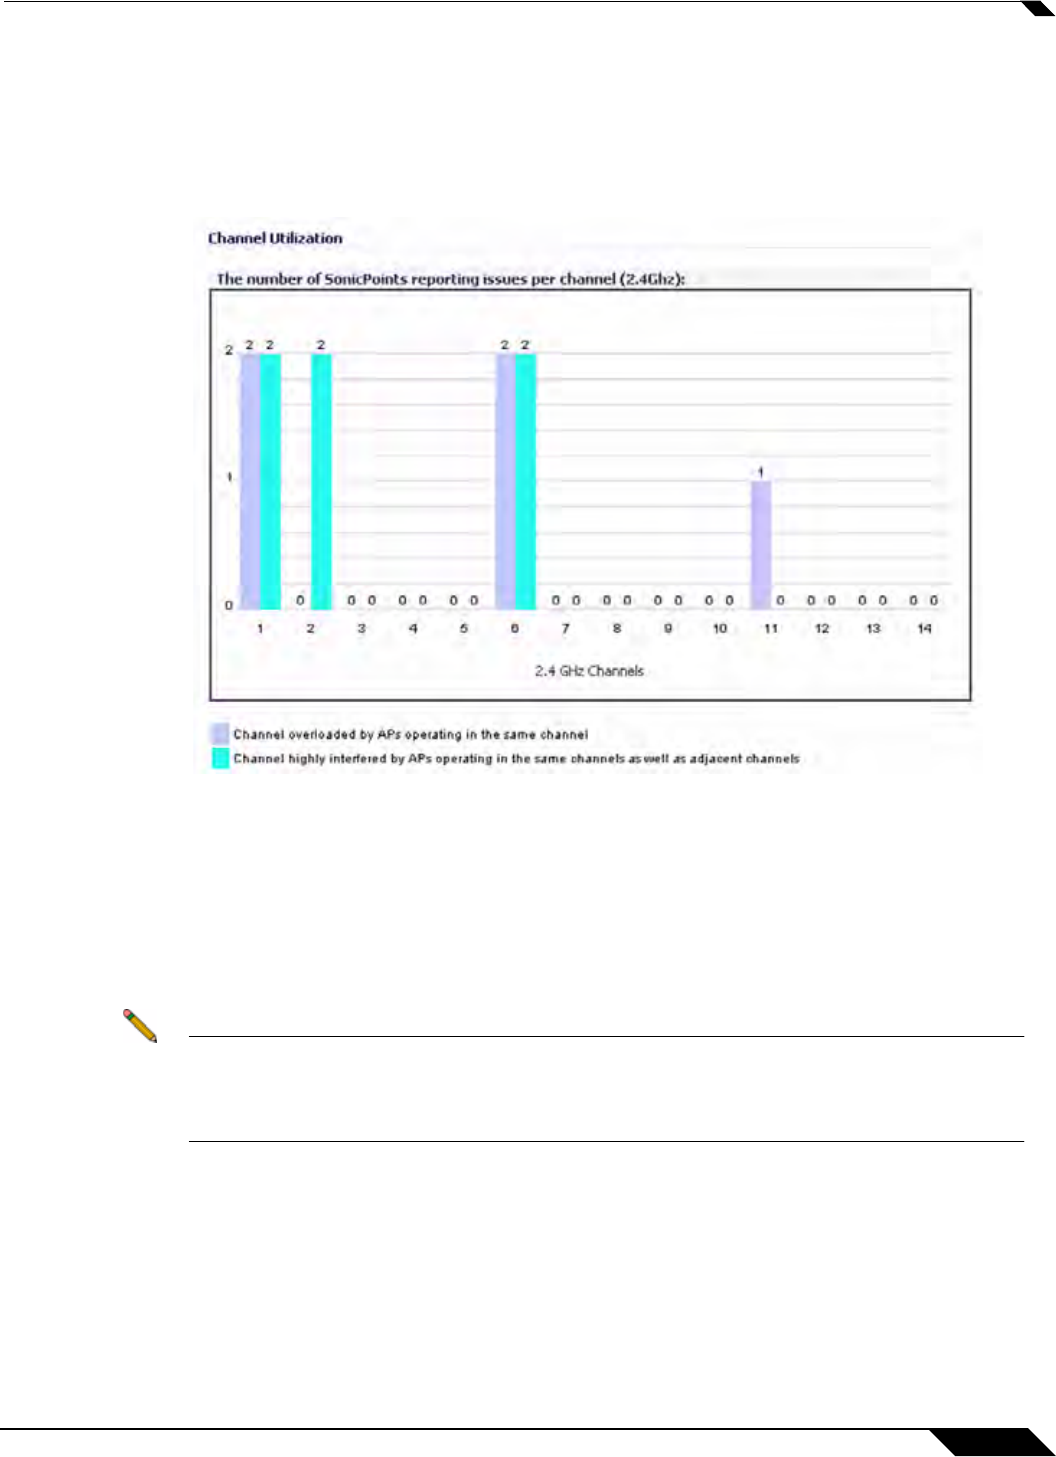
Figure 46:2 RFA Channel Utilization
There are two color bars for each channel. The number on the top of each color bar indicates
the number of SonicPoints that detect the particular issue in that channel. SonicPoints perform
an IDS scan on all available channels upon boot-up and RFA analyzes these scan results to
decide on issues for each channel.
For example: if there are 10 SonicPoints connected, and 6 of these decide that channel 11 is
overloaded, the number on the top of purple color bar will be 6; if 8 SonicPoints decide that
channel 6 is highly interfered, the number on the top of the cyan color bar will be 8. Zero will be
shown for channels no issues.
Note Channels 12, 13, 14 are shown, but in some countries these channels are not used. These
channels are still monitored however, because it is possible for a wireless cracker to set up
a wireless jammer in channel 12, 13, or 14 and launch deny of service service attack to lower
channels.


