Visualization Dashboard
58
SonicOS 5.8.1 Administrator Guide
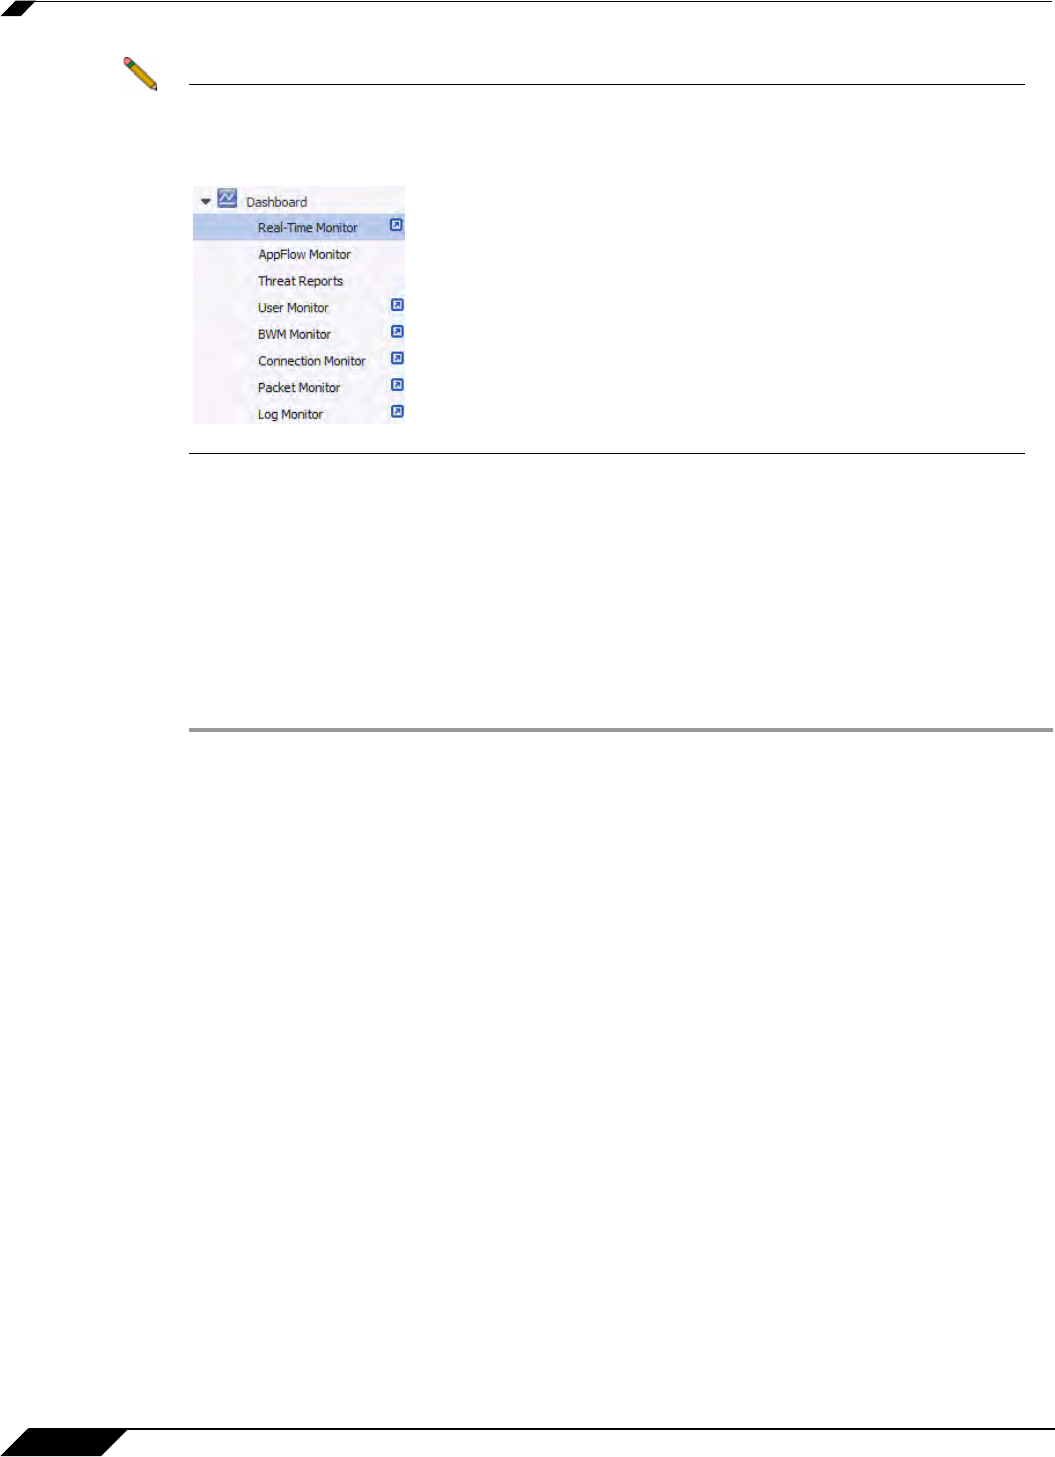
Note Several of the SonicWALL Visualization Dashboard pages now contain a blue pop-up button
that will display the dashboard in a standalone browser window that allows for a wider
display. Click on the blue pop-up icon to the right of the page name in the left-hand
navigating bar to display a dashboard page as a standalone page.
Enabling the Real-Time Monitor and AppFlow Collection
The real-time application monitoring features rely on the flow collection mechanism in order to
collect and display data. Before you can view the “applications” chart in the Real-Time Monitor,
AppFlow Monitor, or AppFlow Reports, you must first enable and configure the flow collection
feature.
To enable Real-Time Monitoring and Internal AppFlow collection:
Step 1 Navigate to the Log > Flow Reporting page in the SonicOS management interface. For on-
the-appliance flow collection, select the Enable AppFlow To Local Collector checkbox.
Select the Enable Real-Time Data Collection checkbox, and select from the Collect Real-
Time Data For pull-down menu the reports you would like to see captured:
• Top apps
• Bits per second
• Packets per second
• Average packet size
• Connections per second
• Core utility
Step 2 To enable these reports, click the Accept button to save your changes.
