System > Diagnostics
171
SonicOS 5.8.1 Administrator Guide
Multi-Core Monitor
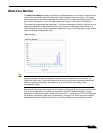
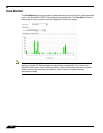
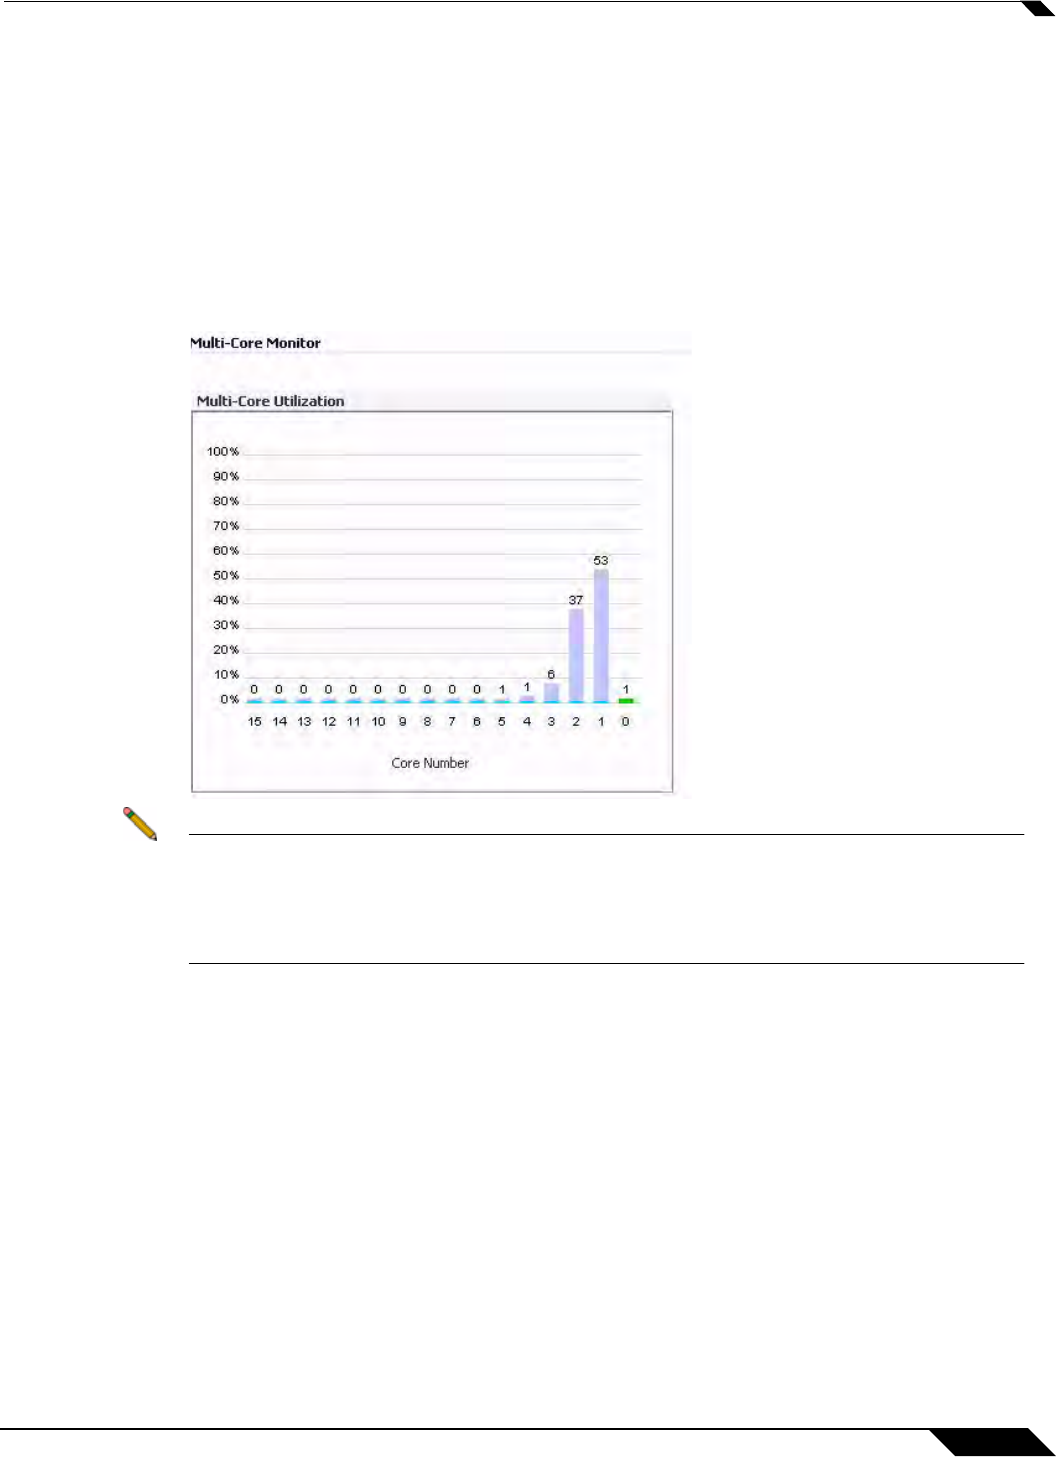
The Multi-Core Monitor displays dynamically updated statistics on utilization of the individual
cores of the SonicWALL security appliances. Core 0 handles the control plane. The control
plane processes all web server requests for the SonicOS UI as well as functions like FTP and
VoIP control connections. Core 0 usage is displayed in green on the Multi-Core Monitor.
The remaining cores handle the data plane. To maximize processor flexibility, functions are not
dedicated to specific cores; instead all cores can process all data plane tasks. Memory is
shared across all cores. UTM processing is displayed in grey for the data plane cores, and all
other processing is displayed in blue.
Note High utilization on Core 0 is normal while browsing the Web management interface and
applying changes. All Web management requests are processed by Core 0 and do not
impact the other cores. Traffic handling and other critical, performance-oriented and system
tasks are always prioritized by the scheduler, and will never be impacted by web
management usage.
Packet ordering and synchronization is maintained by assigning a unique tag to each unique
flow. A flow is defined by five pieces of information: source IP address and port number,
destination IP address and port number, and the protocol. To ensure that TCP and UTM states
are properly maintained, each flow is processed by a single core. Each core can process a
separate flow simultaneously, allowing for up to sixteen flows to be processed in parallel.


