Dashboard > AppFlow Monitor
73
SonicOS 5.8.1 Administrator Guide
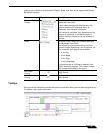
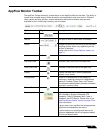
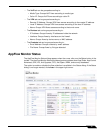
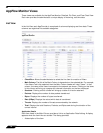
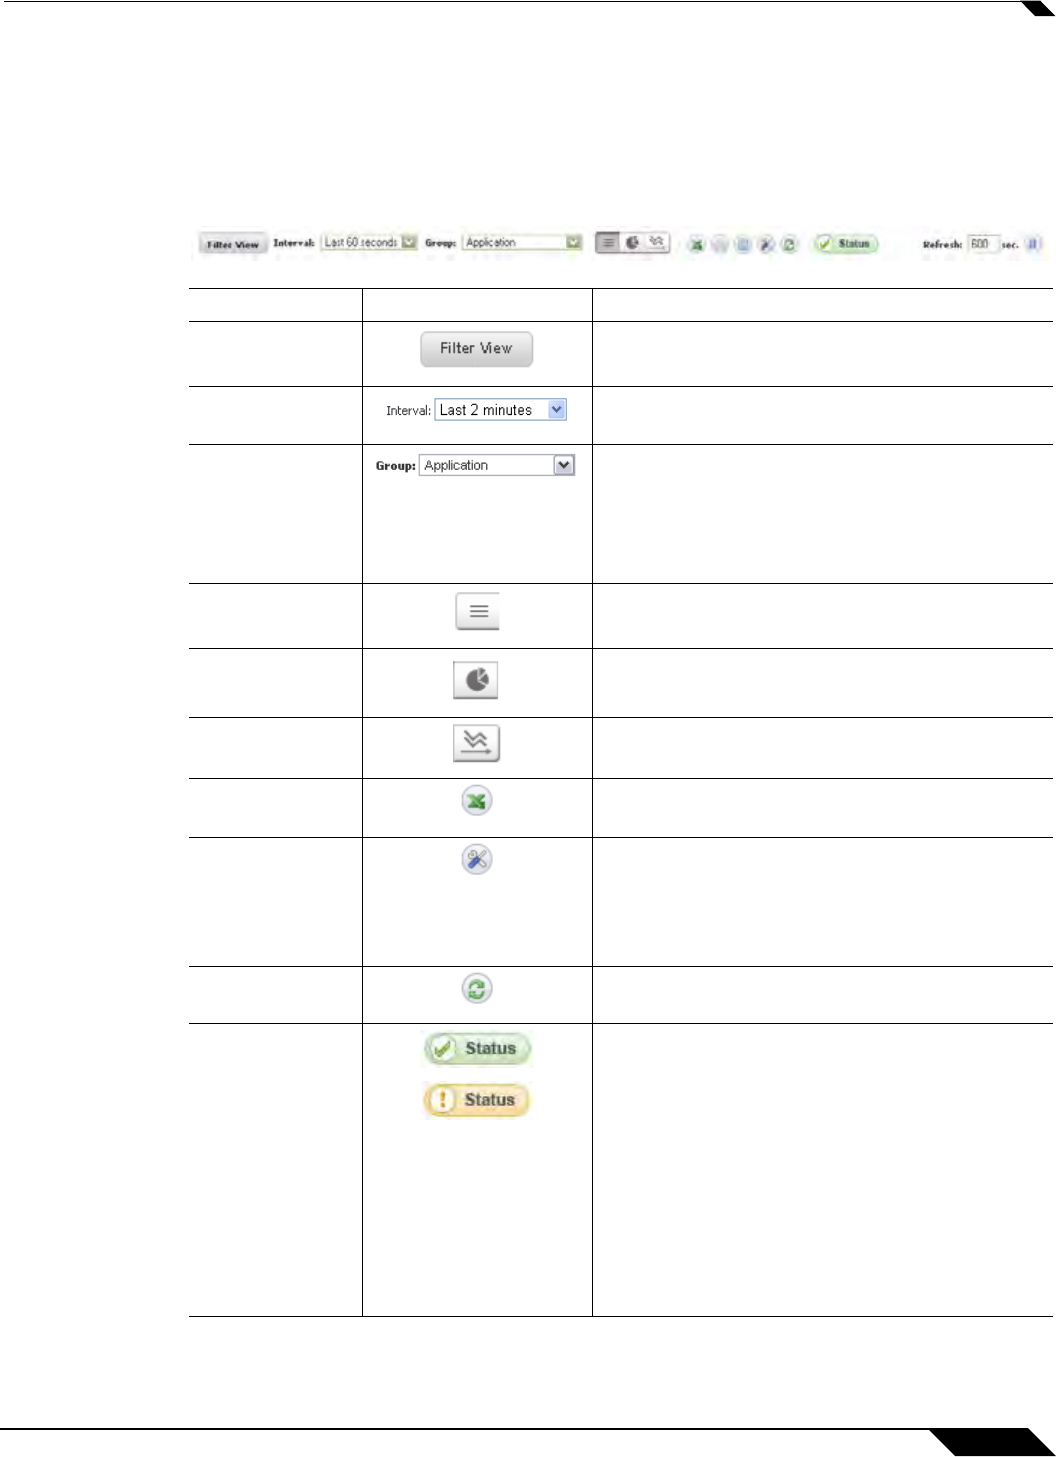
AppFlow Monitor Toolbar
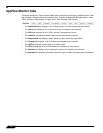
The AppFlow Toolbar allows for customization of the AppFlow Monitor interface. The ability to
create rules and add items to filters allows for more application and user control. Different
views, pause and play abilities, customizable data intervals and refresh rates are also
available to aid in visualizing incoming, real-time data.
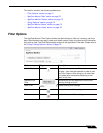
Option Widget Description
Filter View Adds selected items to the filter.
Interval The span of time in which data is collected.
Group Categorizes selections according to the available
grouping options which vary depending on the
tab that is selected.
Please refer to the “Group Options” section on
page 74.
List View Provides a detailed list view of the data flow.
Pie Chart View Provides a pie chart view of the data flow.
Flow Chart View Provides a flow chart view of the data flow.
Export Exports the data flow in comma separated
variable (.csv) format.
Configuration Allows for customization of the display by
enabling or disabling columns for Applications,
Sessions, Packets, Bytes, Rate, and Threats.
Also allows the administrator to enable or disable
commas in numeric fields.
Refresh Button
Refreshes the real-time data.
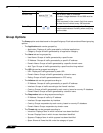
Status Update Provides status updates about App signatures,
GAV Database, Spyware Database, IPS
Database, Country Database, Max Flows in
Database, and CFS Status. Please refer to the
“AppFlow Monitor Status” section on page 75 for
more information.
A green status icon signifies that all appropriate
signatures and databases are active.
A yellow status icon signifies that some or all
signature databases are still being downloaded
or could not be activated.


