


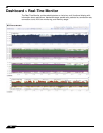
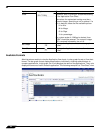
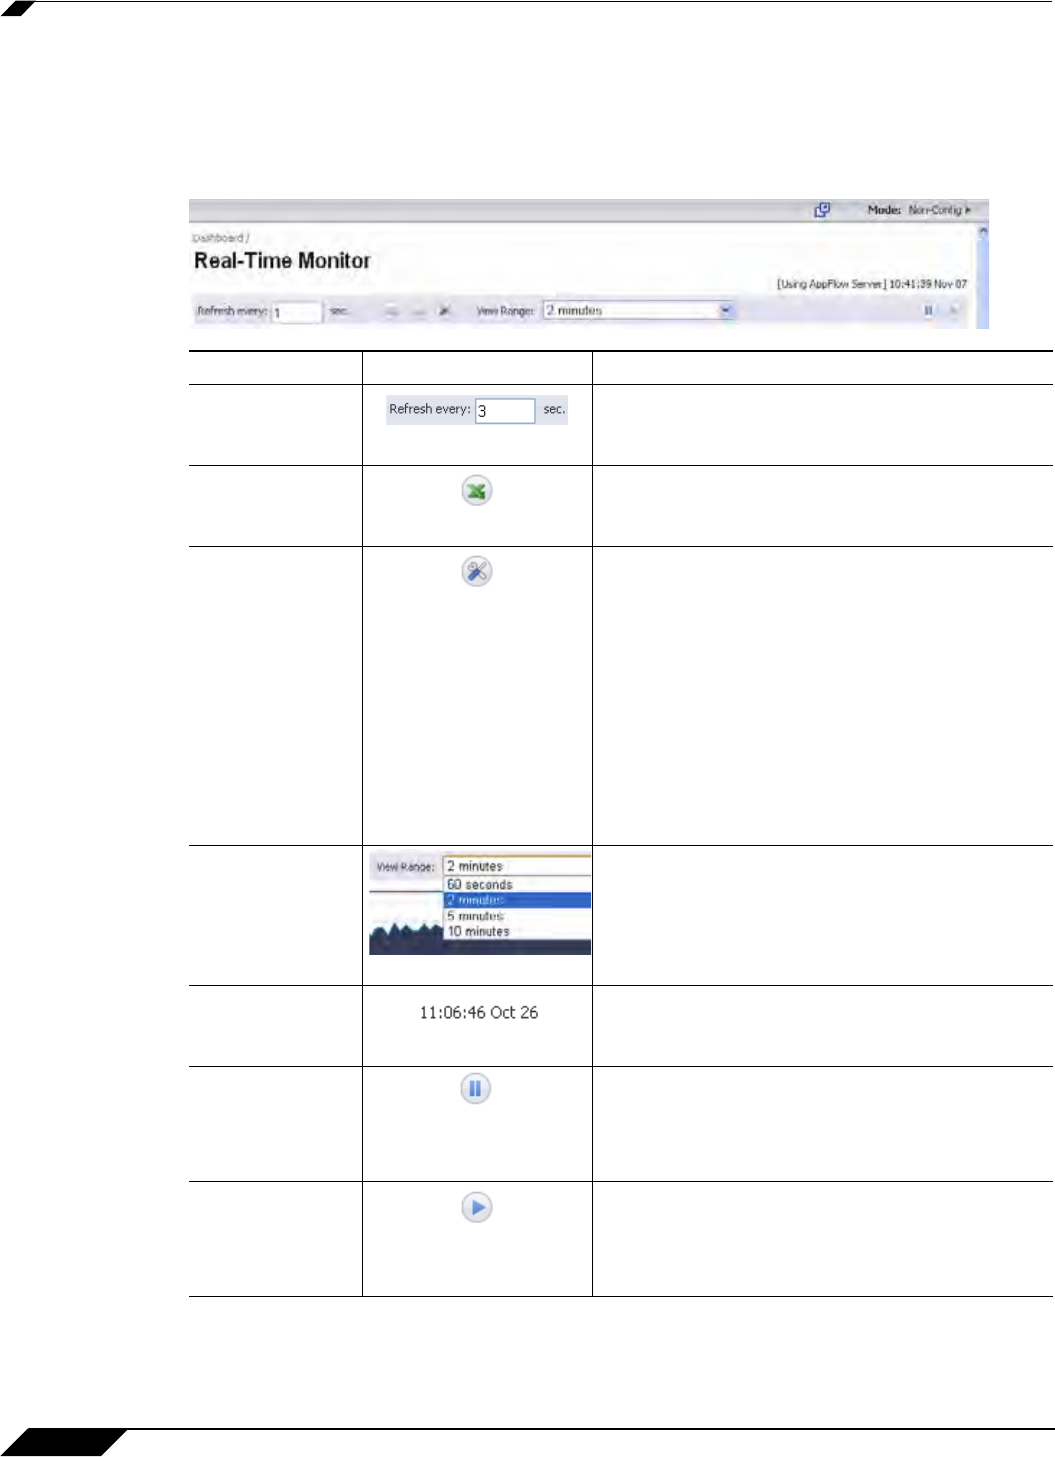
Dashboard > Real-Time Monitor
62
SonicOS 5.8.1 Administrator Guide
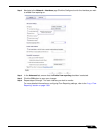
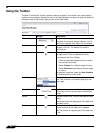
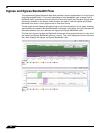
Using the Toolbar
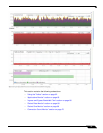
The Real-Time Monitor Toolbar contains features to specify the refresh rate, export details,
configure color palettes, change the amount of data displayed, and pause or play the data flow.
Changes made to the toolbar apply across all the data flows.
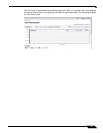
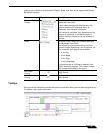
Option
Widget Description
Refresh rate Determines the frequency at which data is
refreshed. A numerical integer between 1 to 10
seconds is required. One second is the default.
Export Exports the data flow into a comma separated
variable (.csv) file. The default file name is
sonicflow.csv.
Configure Allows for customization of the color palette for
the Application Chart and Bandwidth Chart.
To customize the Color Palette:
• Enter the desired hexadecimal color codes in
the provided text fields.
• Select Default for a default range of colors.
• Select Generate to generate a random range
of colors.
If a gradient is desired, select the Use Gradient
box located below the text fields.
View Range Displays data pertaining to a specific span of
time. Two minutes is the default setting for the
view range.
Time & Date Displays the current time in 24-hour format
(hh:mm:ss), and the current date in Month/Day
format.
Pause Freezes the data flow. The time and date will also
freeze.
The Pause button will appear gray if the data flow
has been frozen.
Play Unfreezes the data flow. The time and date will
refresh as soon as the data flow is updated.
The Play button will appear gray if the data flow
is live.