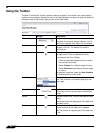
Dashboard > AppFlow Monitor
70
SonicOS 5.8.1 Administrator Guide
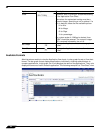
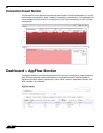
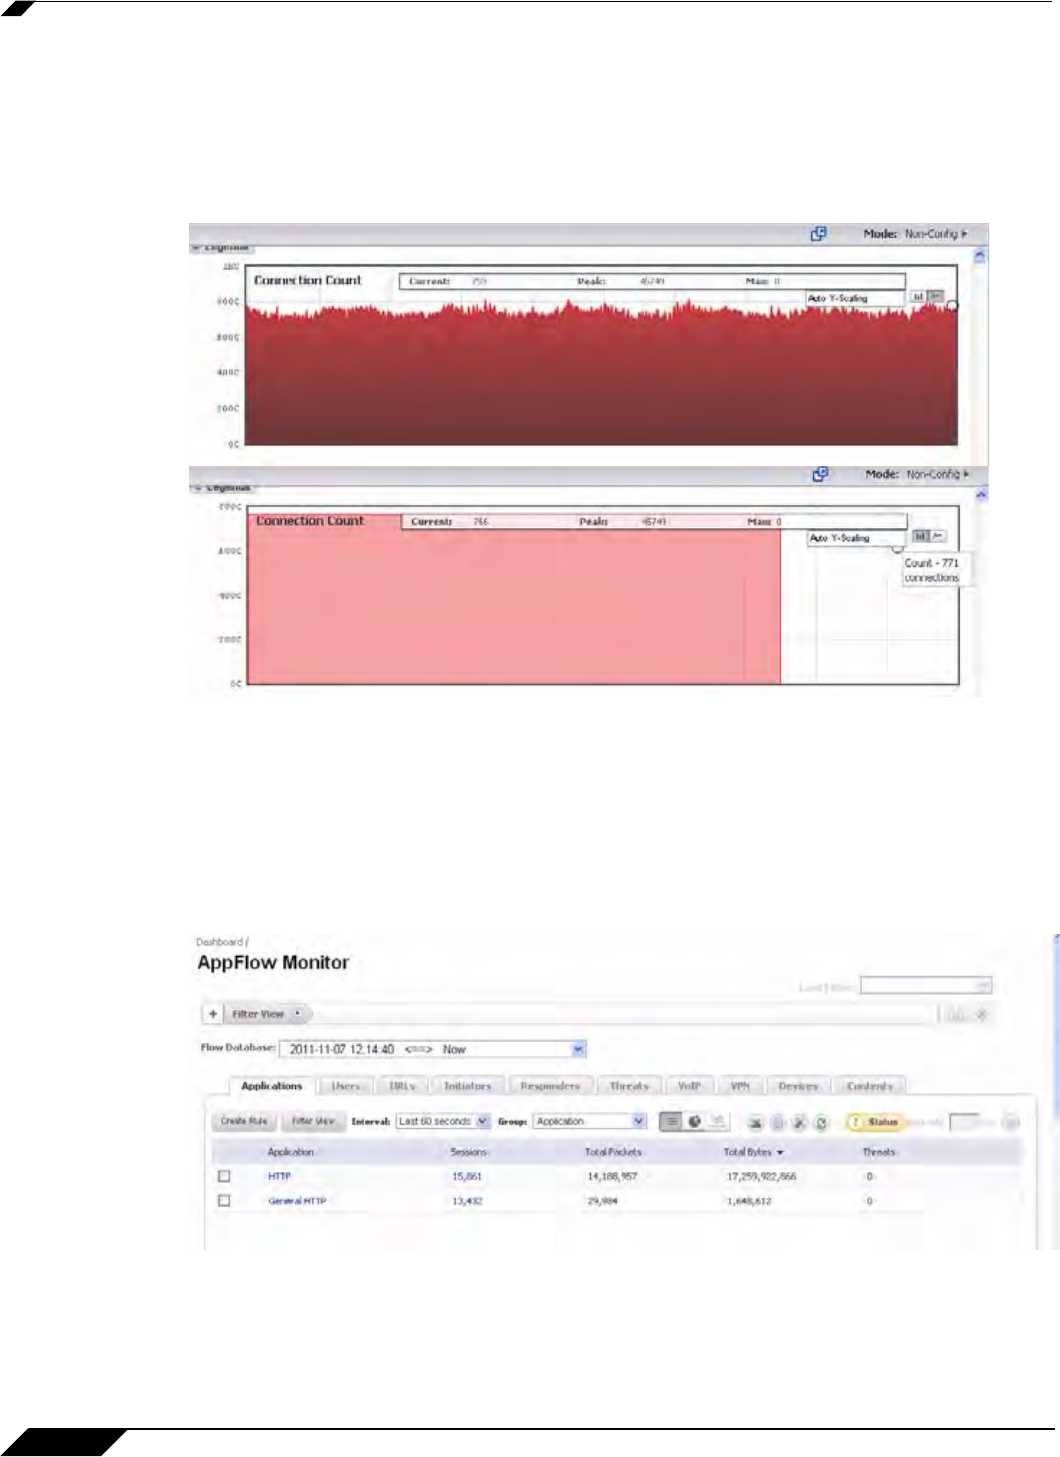
Connection Count Monitor
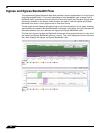
The Connection Count data flow provides the administrator a visual representation of “current”
total number of connections, “peak” number of connections, and maximum. In this example, the
y-axis displays the total number of connections from 0C (zero connections) to 1KC (one kilo
connections).
.
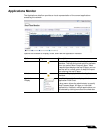
Dashboard > AppFlow Monitor
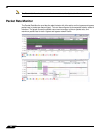
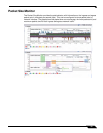
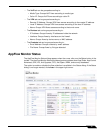
The AppFlow Monitor provides administrators with real-time, incoming and outgoing network
data. Various views and customizable options in the AppFlow Monitor Interface assist in
visualizing the traffic data by applications, users, URLs, initiators, responders, threats, VoIP,
VPN, devices, or by contents.


