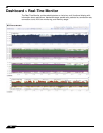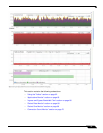
Dashboard > Real-Time Monitor
64
SonicOS 5.8.1 Administrator Guide
Available Formats
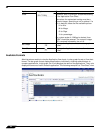
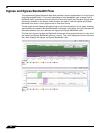
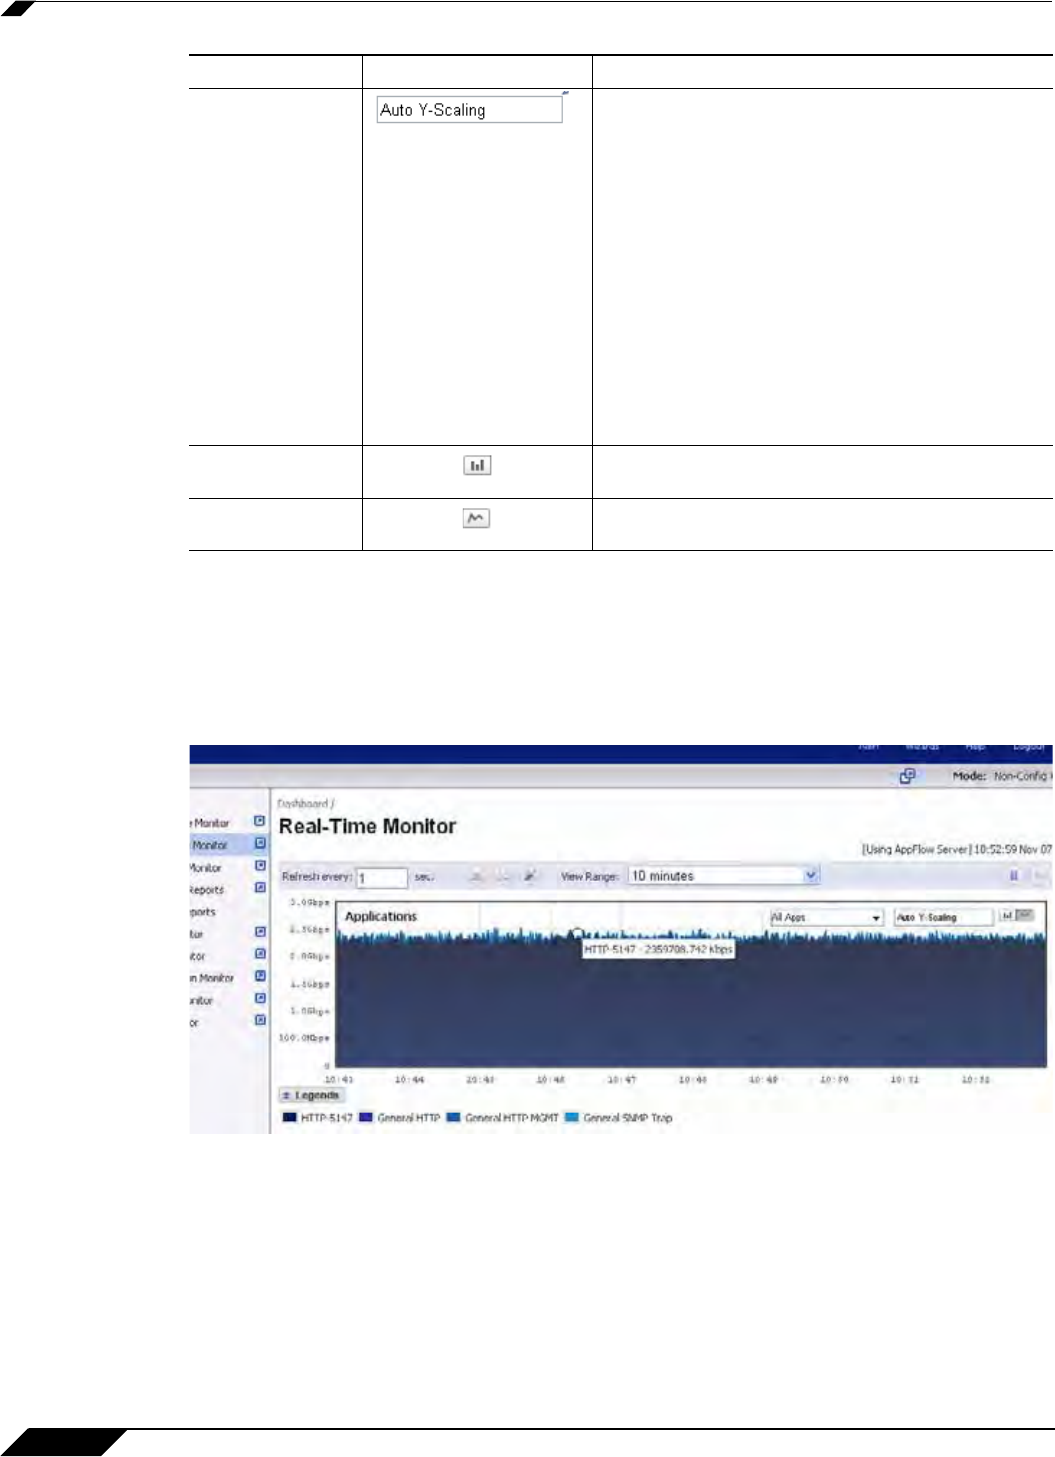
Administrators are able to view the Application flow charts in a bar graph format or flow chart
format. The bar graph format displays applications individually, allowing administrators to
compare applications. In this graph, the x-axis displays the name of the applications. The y-axis
displays the amount of traffic for each application. The following example is a “Flow Chart” view.
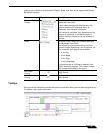
Scale Allows for Auto Y-Scaling or customized scaling
of the Application Flow Chart.
The values for customized scaling must be a
numeric integer. Specifying a unit is optional. If a
unit is desired, these are the available options:
• K for Kilo.
• M for Mega.
• G for Giga.
• % for percentage.
If a custom scale of 100Kbps is desired, then
“100K” should be entered. The numeric integer
100 is entered followed by the unit K.
Bar Graph
Displays the Applications data in a bar graph
format.
Flow Chart
Displays the Applications data in a flow chart
format.
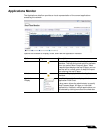
Option Widget Description


