


780
QPSK EVM Measurement
not specified
or n = 1
Returns the following 11 scalar results:
1. RMS EVM is a floating point number (in percent) of EVM over the entire measurement area.
2. RMS EVM maximum is the maximum RMS EVM over the average counts.
3. Peak EVM is a floating point number (in percent) of peak EVM in the measurement area.
4. Peak EVM maximum is the maximum peak EVM over the average counts.
5. Magnitude Error is a floating point number (in percent) of averaged magnitude error over the
entire measurement area.
6. Magnitude Error maximum is a floating point number over the average counts.
7. Phase Error is a floating point number (in degrees) of the averaged phase error over the entire
measurement area.
8. Phase Error maximum is the maximum phase error over the average counts.
9. Frequency Error is a floating point number (in Hz) of the frequency error in the measured signal.
10. Frequency Error maximum is the maximum frequency error over the average counts.
11. I/Q Origin Offset is a floating point number (in dB) of the I and Q error (magnitude squared) offset
from the origin.
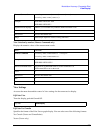
2 EVM trace – returns a series of floating point numbers (in percent) that represent each sample in the
EVM trace. The first number is the symbol 0 decision point. There are X points per symbol
(X=points/chip). Therefore, the decision points are at 0, 1*X, 2*X, and so on.
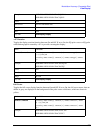
3 Magnitude error trace – returns a series of floating point numbers (in percent) that represent each
sample in the magnitude error trace. The first number is the symbol 0 decision point. There are X
points per symbol (X=points/chip). Therefore, the decision points are at 0, 1*X, 2*X, …
4 Phase error trace – returns a series of floating point numbers (in percent) that represent each sample in
the phase error trace. The first number is the symbol 0 decision point. There are X points per symbol
(X=points/chip). Therefore, the decision points are at 0, 1*X, 2*X, …
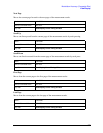
5 Corrected measured trace – returns a series of floating point numbers that alternately represent I and Q
pairs of the corrected measured trace. The magnitude of each I and Q pair are normalized to 1.0. The
first number is the I sample of symbol 0 decision point and the second number is the Q sample of
symbol 0 decision point. There are X points per symbol (X=points/chip). Therefore, the series of
numbers is:
1st number = I of the symbol 0 decision point
2nd number = Q of the symbol 0 decision point
…
(2*X)+1 number = I of the symbol 1 decision point
(2*X)+2 number = Q of the symbol 1 decision point
…
(2*X)*N+1 th number = I of the symbol N decision point
(2*X)*N+2 th number = Q of the symbol N decision point
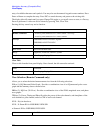
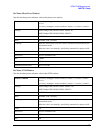
n Results Returned