


1039
Meas
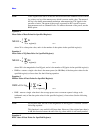
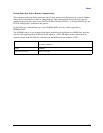
where Xi is a data point value, and n is the number of data points in the specified region(s).
Equation 5
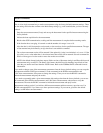
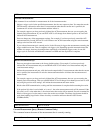
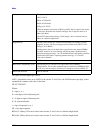
RMS Value of I/Q Data Pairs for Specified Region(s)
where Xi is the complex value representation of an I/Q pair, Xi* its conjugate complex number, and n
is the number of I/Q pairs in the specified region(s).
Once you have the rms value for a region of trace data (linear or I/Q), you may want to calculate the
mean power. You must convert this rms value (peak volts) to power in dBm:
10 x log[10 x (rms value)
2
]
• SAMPle - returns the first data value (x,y pair) for the specified region(s) of trace data. For I/Q trace
data, the first I/Q pair is returned.
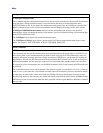
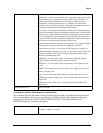
• SDEViation - returns a single value that is the arithmetic standard deviation for the data point values
for the specified region(s) of trace data. See the following equation.
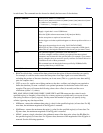
For I/Q trace data, the standard deviation of the magnitudes of the I/Q pairs is returned. See the
following equation.
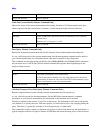
Equation 6
Standard Deviation of Data Point Values for Specified Region(s)
where Xi is a data point value, X is the arithmetic mean of the data point values for the specified
region(s), and n is the number of data points in the specified region(s).
where |Xi| is the magnitude of an I/Q pair, X is the mean of the magnitudes for the specified region(s),
and n is the number of data points in the specified region(s).
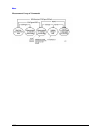
• PPHase - returns the x,y pairs of both rms power (dBm) and arithmetic mean phase (radian) for every
specified region and frequency offset (Hz). The number of pairs is defined by the specified number of
Σ
Xi
2
1
_
n
Xi
∈ region(s)
RMS =
vsd27-4
Σ
Xi Xi*
1
_
n
Xi
∈ region(s)
RMS =
vsd27-5
Σ
(Xi – X)
2
1
_
n
Xi
∈ region(s)
SDEV =
–
vsd27-7
Σ
(|Xi| – X)
2
1
_
n
Xi
∈ region(s)
SDEV =
–
vsd27-8