


1055
Meas Setup
Interpolation
Accesses a menu which lets you set the frequency and amplitude interpolation of the selected limit.
Frequency Interpolation
This key is grayed out if Time is the selected X-axis units. Sets the interpolation between frequency points,
allowing you to determine how limit trace values are computed between points in a limit table. The available
interpolation modes are linear and logarithmic. If frequency interpolation is logarithmic (Log), frequency values
between limit points are computed by first taking the logarithm of both the table values and the intermediate value.
A linear interpolation is then performed in this logarithmic frequency space. An exactly analogous manipulation is
done for logarithmic amplitude interpolation.
Note that the native representation of amplitude is in dB.
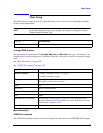
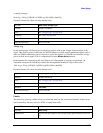
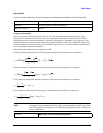
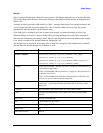
For linear amplitude interpolation and linear frequency interpolation, the interpolation is computed as:
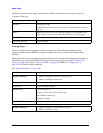
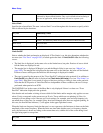
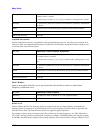
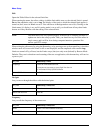
For linear amplitude interpolation and log frequency interpolation, the interpolation is computed as:
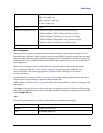
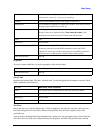
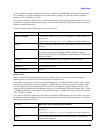
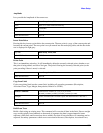
For log amplitude interpolation and linear frequency interpolation, the interpolation is computed as:
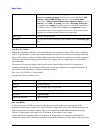
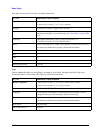
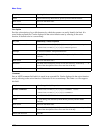
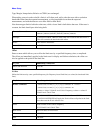
For log amplitude interpolation and log frequency interpolation, the interpolation is computed as:
NOTE Interpolation modes determine how limit values are computed between points in the limit
table. The appearance of a limit trace is also affected by the amplitude scale, which may be
linear or logarithmic.
Key Path
Meas Setup, Limits, Properties
Readback [Lin|Log Frequency, Lin|Log Amplitude]
Initial S/W Revision A.02.00
Key Path
Meas Setup, Limits, Properties, Interpolation
()
)10
1010
log(20
20
1
2020
1
i
ii
y
i
ii
yy
ff
ff
y +−
−
−
=
+
+
()
)10loglog
loglog
1010
log(20
20
1
2020
1
i
ii
y
i
ii
yy
ff
ff
y +−
−
−
=
+
+
()
ii
ii
ii
yff
ff
yy
y +−
−
−
=
+
+
1
1
()
ii
ii
ii
yff
ff
yy
y +−
−
−
=
+
+
loglog
loglog
1
1