6.4.5
6 - 95
(c) Set the cursors and click the Measure button to start measurement. When there are
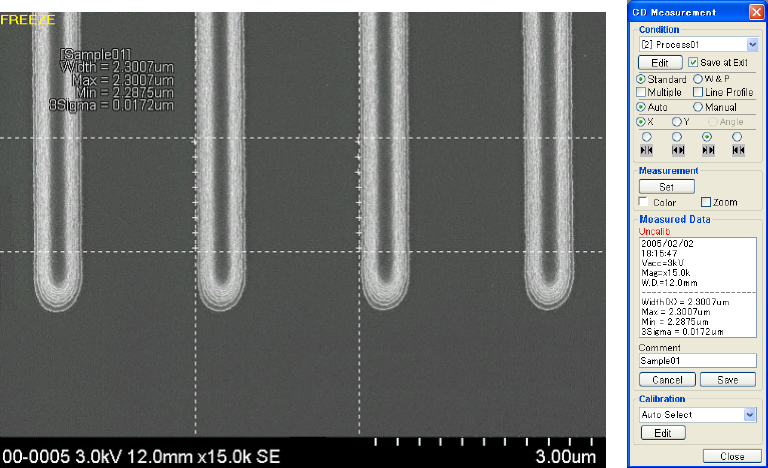
two or more measurement points, a "+" sign appears at the location where an edge
was detected for each measurement point, and when the measurement of all the
points is finished, the cursor moves to the part representing the average value of the
points.
(d) When Line Profile has been set, a signal waveform (line profile) will appear.
Fig. 6.4-25 Auto Measurement Result Display
(e) The measurement results are indicated as follows.
Width : Measured value of one point, or average of measured values of multiple
points
Max : Maximum of measured values
Min : Minimum of measured values
3 Sigma : Standard deviation of measured value
NOTICE: 1. When "1" is set for Measurement Point in the measurement parameters, the
maximum, minimum and standard deviation values are not indicated.
2. Standard deviation is calculated using numeric values having more digits than the
measured value indication. Therefore the standard deviation may not be "0"
even if the maximum and minimum values indicated in the measured results are
equal to each other.
3. The standard deviation represents a degree of edge roughness of the pattern
under measurement. Use the standard deviation function as required.
4. A comment entered in the comment entry box on CD Measurement window
appears on the measured results.


