


6.4 CD Measurement Function (Option)
6 - 62
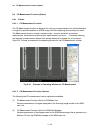
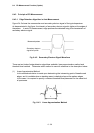
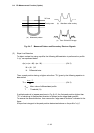
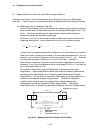
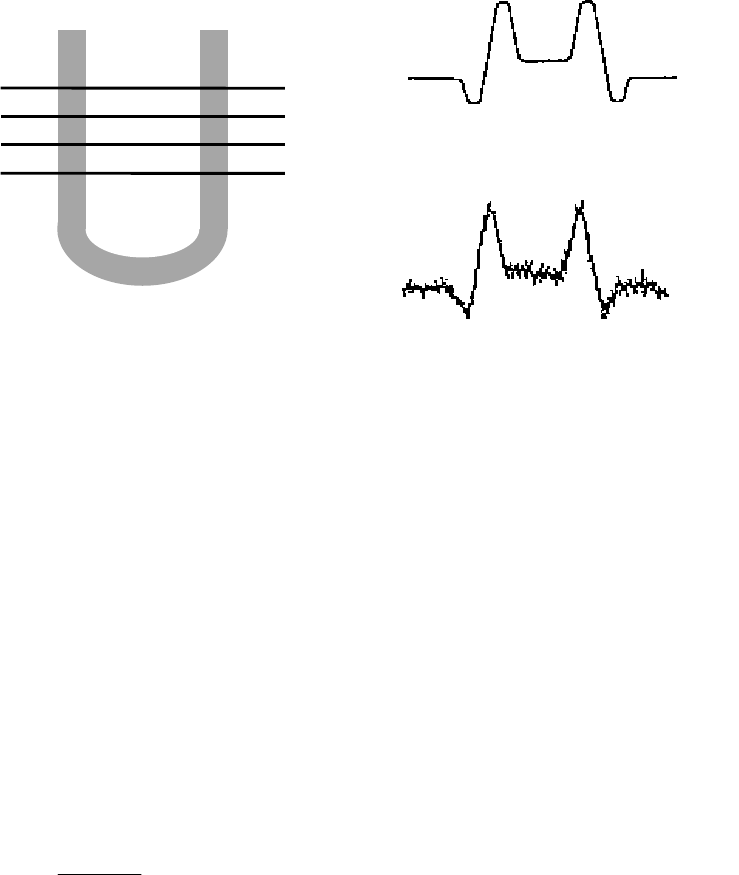
Fig. 6.4-7 Measured Pattern and Secondary Electron Signals
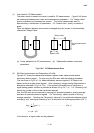
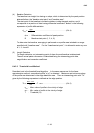
(3) Slope Line Detection
To detect a slope line using a profile, the following differentiation is performed on profile
"s (n)" as expressed below.
d(n) = s(n + M) - s(n - M)................................................. (6.4.2)
M = (N - 1)/2
N: Differential size
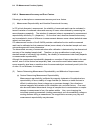
Then, a peak position having a higher value than "Th" given by the following equation is
determined.
Th = ................................................................(6.4.3)
d
max
: Max. value of differentiated profile
T : Threshold (%)
If multiple peaks d (n) appear as shown in Fig. 6.4-5, the first peak position higher than
"Th" in searching in the specified direction is defined as the target peak position.
To reverse the search direction, then reverse the "edge search direction" indicated in the
figure.
A slope line is tangent to the peak position determined above on the profile "s (n)".
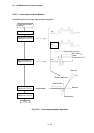
“N” lines
Overlay area
(a) Measured pattern
(b) Waveform after overlay
(c) Poor S
/
N ratio of image
d
max
× T
100