1Ć52
Rapidlab 800 Operator's Manual
Quality control limits are established by calculating the mean and standard
deviation (SD) from multiple measurements of the QC material.
5
Typical QC limits
use ± 2 SD or ± 3 SD where there is approximately a 95.5% probability that a
result is within the 2 SD range and approximately a 99.7% probability that a result
is within the 3 SD range when the system is performing as expected. QC results are
compared to the established limits to evaluate system performance. If the results
are within the established limits, the system is considered to be performing
properly and patient results may be accepted. If the results are outside the
established limits, the system may have problems that should be investigated
before reporting patient results. Take corrective action according to procedures
established for your laboratory. Bayer Diagnostics recommends that you do the
following:
S Ensure that the calibration reagents and QC materials are not expired or have not
deteriorated. Visible signs of deterioration include color changes or cloudiness of
the reagents or QC materials.
S Ensure that you followed the operating procedures recommended in this manual.
S Ensure that you handled and sampled the QC materials according to the
procedures recommended by the manufacturer.
S Rerun the QC materials.
QC File Information
You can define up to 12 QC files on an 800 system. Each file can store up to 150
QC sample reports. The file maintains the month-to-date and lot-to-date statistics,
which include the mean, standard deviation, and coefficient of variation. After a
QC file reaches 150 reports the system deletes the oldest report in the file to make
room for a new QC report.
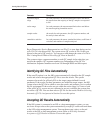
Each QC file contains the following information:
Parameter Description
file number the number that identifies the file
QC ID the code that identifies the QC material assigned to the file
level the level of the QC material
lot number the manufacturing lot number of the QC material
expiration date the last date you can use the QC material
expected (target) mean
for each parameter, the expected average measured value of
the QC samples
(Continued)


