


5. Press Home to return to the Ready screen.
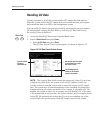
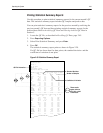
Viewing and Printing LeveyĆJennings Charts
Use this procedure to view and print Levey-Jennings charts of the current month’s
QC data.
You can print Levey-Jennings charts for the previous month by archiving the
previous month’s QC data and then printing Levey-Jennings charts of the archived
data. Refer to Archiving QC Data and Viewing Archived QC Data in Section 5.
1. Access the Recall QC Data screen from the Menu screen:
a. Select
4 Data Recall and press Enter.
b. Select 2 QC Data and press Enter.
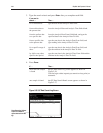
The QC Data Search Criteria screen appears.
2. Type only the file number and press
Enter.
The QC Data Search Criteria Log screen appears.
3. Select
Reporting Options.
NOTE: You can view the previous month’s Levey-Jennings charts before you
analyze the first QC sample of the current month. After you analyze the first QC
sample of the current month, Levey-Jennings charts contain data only for the
current month.
4. Select either Levey-Jennings Current Month or Levey-Jennings Previous
Month.
5. Press
OK.
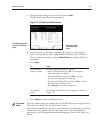
6. The Levey-Jennings Parameter Selection screen appears.
7. Select the parameter you want to display on the chart and press
Enter.
8. Press
Done.
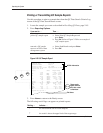
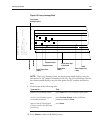
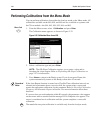
The Levey-Jennings Chart appears, as shown in Figure 2-30.
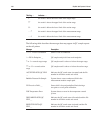
4
Menu Code
2