


1 2 3 4 5 6 7 8 9 10
11 12 13 14 15 16 17 18 19
20 21 22 23 24 25 26 27 28
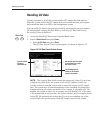
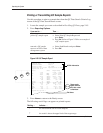
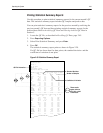
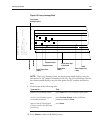
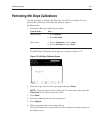
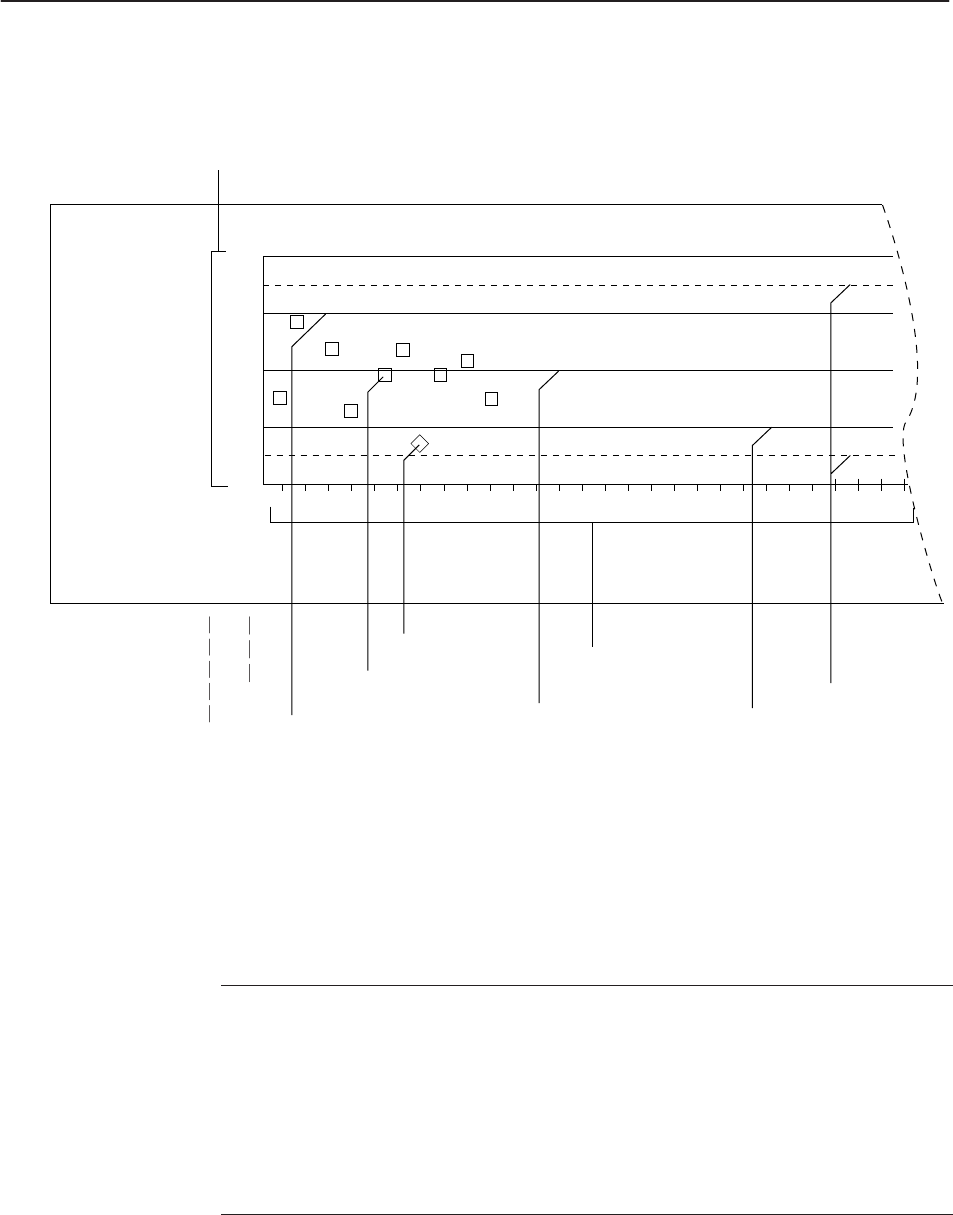
QUALITY CONTROL LEVEY-JENNINGS CHART
April 10 1994 16:25
System 850-1001
QC ID 473841 LEVEL 1 Lot 331302
Expiration Date DEC 12 1995
pCO
2
Month APR
88.3
78.3
68.3
58.3
48.3
Y-axis shows
measured values
Accepted Values
Rejected Values
X-axis shows days
of the month
Upper Target Limit
(+2SD)
Lower Target Limit
(-2SD)
Target Value
(mean)
±3SD
NOTE:ĄĂThe Levey-Jennings chart for the previous month displays only the
data points for QC samples remaining in the file. The Levey-Jennings chart for
the current month displays only the data points for QC samples analyzed to
date.
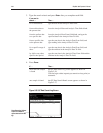
9. Perform one of the following tasks.
print a Levey-Jennings report press Print. The Levey-Jennings report prints.
view a Levey-Jennings report
for another parameter
press Previous Screen. Select a different
parameter and press
Done.
return to the QC Data Search
Criteria screen or the QC Data
Search Log
press Done.
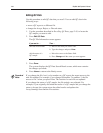
10. Press Home to return to the Ready screen.