


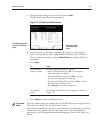
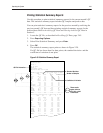

If the QC Data Search Log contains samples from more than one file and you
choose to view a Levey-Jennings chart, the chart that appears is for the file number
of the sample that you selected on the log.
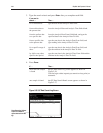
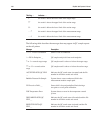
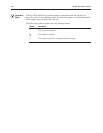
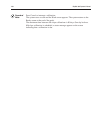
The following symbols appear on Levey-Jennings charts:
Symbol Description
j The results are accepted.
The sample is rejected.
x
The result is beyond the 4 standard deviations range.
Procedural
Notes