


Configuration and Use Manual 77
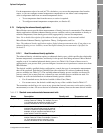
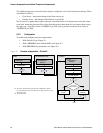
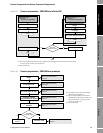
Optional Configuration
Required Configuration Optional ConfigurationUsing the TransmitterUsing a PROFIBUS Host Required Configuration Optional ConfigurationUsing the TransmitterUsing a PROFIBUS Host Required Configuration Optional ConfigurationUsing the TransmitterUsing a PROFIBUS Host Required Configuration Optional ConfigurationUsing the TransmitterUsing a PROFIBUS Host
For the temperature value to be used in CTL calculation, you can use the temperature data from the
sensor, or you can configure external temperature compensation to use either a static temperature
value or temperature data from an external temperature device.
• To use temperature data from the sensor, no action is required.
• To configure external temperature compensation, see Section 9.3.
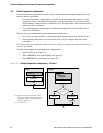
8.15 Configuring the enhanced density application
Micro Motion sensors provide direct measurements of density, but not of concentration. The enhanced
density application calculates enhanced density process variables, such as concentration or density at
reference temperature, from density process data, appropriately corrected for temperature.
Note: For a detailed description of the enhanced density application, see the manual entitled
Micro Motion Enhanced Density Application: Theory, Configuration, and Use.
Note: The enhanced density application requires liquid volume measurement units. If you plan to use
enhanced density process variables, ensure that liquid volume flow measurement is specified. See
Section 8.2.
8.15.1 About the enhanced density application
The enhanced density calculation requires an enhanced density curve, which specifies the relationship
between temperature, concentration, and density for the process fluid being measured. Micro Motion
supplies a set of six standard enhanced density curves (see Table 8-16). If none of these curves is
appropriate for your process fluid, you can configure a custom curve or purchase a custom curve from
Micro Motion.
The derived variable, specified during configuration, controls the type of concentration measurement
that will be produced. Each derived variable allows the calculation of a subset of enhanced density
process variables (see Table 8-17). The available enhanced density process variables can be used in
process control, just as mass flow rate, volume flow rate, and other process variables are used. For
example, an event can be defined on an enhanced density process variable.
• For all standard curves, the derived variable is Mass Conc (Dens).
• For custom curves, the derived variable may be any of the variables listed in Table 8-17.
The transmitter can hold up to six curves at any given time, but only one curve can be active (used for
measurement) at a time. All curves that are in transmitter memory must use the same derived variable.
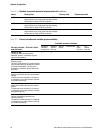
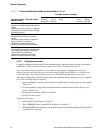
Table 8-16 Standard curves and associated measurement units
Name Description Density unit Temperature unit
Deg Balling Curve represents percent extract, by mass, in
solution, based on °Balling. For example, if a wort
is 10 °Balling and the extract in solution is 100%
sucrose, the extract is 10% of the total mass.
g/cm
3
°F
Deg Brix Curve represents a hydrometer scale for sucrose
solutions that indicates the percent by mass of
sucrose in solution at a given temperature. For
example, 40 kg of sucrose mixed with 60 kg of
water results in a 40 °Brix solution.
g/cm
3
°C
Deg Plato Curve represents percent extract, by mass, in
solution, based on °Plato. For example, if a wort is
10 °Plato and the extract in solution is 100%
sucrose, the extract is 10% of the total mass.
g/cm
3
°F