


104 Micro Motion
®
Model 2400S Transmitters for PROFIBUS-DP
Measurement Performance
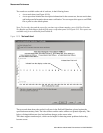
Test results are available at the end of each test, in the following forms:
• A test result chart (see Figure 10-10).
• A test report that includes the descriptive information for the current test, the test result chart,
and background information about meter verification. You can export this report to an HTML
file or print it to the default printer.
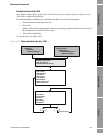
Note: To view the chart and the report for previous tests without running a test, click View Previous
Test Results and Print Report from the first meter verification panel. See Figure 10-5. Test reports are
available only for tests initiated from ProLink II.
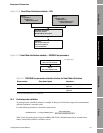
Figure 10-10 Test result chart
The test result chart shows the results for all tests in the ProLink II database, plotted against the
specification uncertainty limit. The inlet stiffness and the outlet stiffness are plotted separately. This
helps to distinguish between local and uniform changes to the sensor tubes.
This chart supports trend analysis, which can be helpful in detecting meter problems before they
become severe.
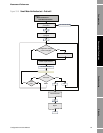
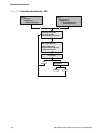
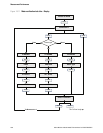
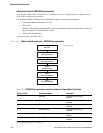
Initiated from ProLink II
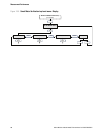
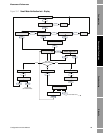
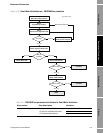
Initiated from the display or other tool