


Configuration and Use Manual 105
Measurement Performance
Measurement Performance DefaultsTroubleshootingCompensation
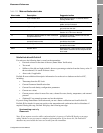
Note the following:
• The test result chart may not show all test results, and test counters may not be continuous.
ProLink II stores information about all tests initiated from ProLink II and all tests available on
the transmitter when the test database is synchronized. However, the transmitter stores only the
twenty most recent test results. To ensure a complete result set, always use ProLink II to
initiate the tests, or synchronize the ProLink II database before overwriting occurs.
• The chart uses different symbols to differentiate between tests initiated from ProLink II and
tests initiated using a different tool. A test report is available only for tests that were initiated
from ProLink II.
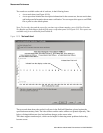
• You can double-click the chart to manipulate the presentation in a variety of ways (change
titles, change fonts, colors, borders and gridlines, etc.), and to export the data to additional
formats (including “to printer”).
You can export this chart to a CSV file for use in external applications.
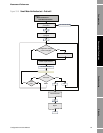
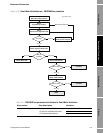
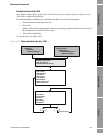
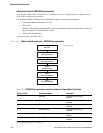
Detailed test data with the display
Note: Requires Smart Meter Verification. No detailed test data is available with the original version
of the meter verification application.
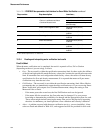
For each Smart Meter Verification test, the following data is stored on the transmitter:
• Powered-on hours at the time of the test
• Test result
• Stiffness of the left and right pickoffs, shown as percentage variation from the factory value. If
the test aborted, 0 is stored for these values.
• Abort code, if applicable
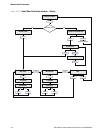
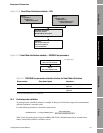
To view this data, see Figures 10-6 and 10-11.