DMA Operations Guide Active Calls
78 Polycom, Inc.
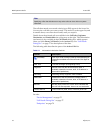
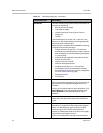
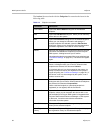
Bandwidth The table at the top lists each throttle point that the call
traverses and shows its:
• Bit rate limit per call (kbps)
• Total capacity (kbps)
• Used bit rate (kbps) in each class of service
• Weight (%)
• Territory
If the throttle point is a subnet, site, or site link, a link
takes you to the corresponding site topology page with
the throttle point entity selected.
Below the table, the data used in bandwidth processing
is displayed (all bit rates are kbps):
• Formal maximum bit rate limit — the maximum
allowed bit rate considering the per call bit rates of
each throttle point, but not considering total capacity
or current usage
• Available bit rate capacity in each class of service
and for the call’s class
• Class of service for the call
• Minimum downspeed bit rate
• Available bit rate limit (%) — the maximum
percentage of remaining bandwidth at a throttle
point that will be given to any one call (configurable
on the Call Server Settings page)
• Requested bit rate
• Final bit rate
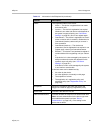
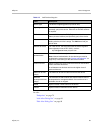
Call Events Lists each event in the call and its attributes.
When the system is operating as a SIP proxy server, the
list includes all SIP signaling messages except 100
TRYING.
Hover over an attribute label to see a description. Click
Show Message to see the signaling message. Click
Show QoS Data to see detailed quality of service
statistics.
Property Changes Lists each property change in the call, showing the
value, time, and sequence number of the associated
event.
QoS Quality of service data is only available if one of the
endpoints is a registered H.323 endpoint that supports
IRQs. This tab displays a graph showing how QoS
varied during the call. The horizontal scale and
frequency of data points (dots on the lines of the graph)
vary based on the length of the call.
Hover over a data point to see the value at that point.
Table 5-2 Call Details dialog box (continued)
Tab/Field/Column Description


