11-17
Cisco Broadband Access Center 3.8 Administrator Guide
OL-27172-01
Chapter 11 Monitoring Cisco Broadband Access Center
Monitoring STUN Statistics
2006-04-11:13:09 PACE statistics last 5 minutes- In Queue 0; Dropped 0; Dropped-Full Queue
0; Batches Received 0; Internal Batches Received 0; Succeed 0; Failed 0; Processed 0;
Processing avgTime 0 msec; Batch maxTime 0 msec; In Queue maxTime 0 msec; Processing
maxTime 0 msec; CRS Completed 0
Note The number of statistics available varies on the component specified.
Example 11-4 Summary Output Through runStatAnalyzer.sh
# runStatAnalyzer.sh -s 2006-04-11:12:59 -e 2006-04-11:13:29 -c pace -f summary
2006-04-11:13:04 PACE statistics last 5 minutes- In Queue 0; Dropped 0; Dropped-Full Queue
0; Batches Received 0; Internal Batches Received 0; Succeed 0; Failed 0; Processed 0;
Processing avgTime 0 msec; Batch maxTime 0 msec; In Queue maxTime 0 msec; Processing
maxTime 0 msec; CRS Completed 0
2006-04-11:13:29 PACE statistics last 30 minutes- In Queue 0; Dropped 0; Dropped-Full
Queue 0; Batches Received 0; Internal Batches Received 0; Succeed 0; Failed 0; Processed
0; Processing avgTime 0 msec; Batch maxTime 0 msec; In Queue maxTime 0 msec; Processing
maxTime 0 msec; CRS Completed 0
Note Summarized data is visible only if a complete set of data is available for the given interval. For example,
the summary output of a 30-minute summarized interval appears only if there is 30 minutes worth of
data. Based on the data available, the summarized time intervals are 5 minutes, 30 minutes, 60 minutes,
3 hours, 6 hours, 12 hours, 24 hours, 7 days, 14 days, 21 days, and 30 days.
Monitoring STUN Statistics
Cisco BAC STUN server provides a rich set of statistics to aid in troubleshooting system performance
and error conditions while communicating with the device. It also performs troubleshooting when
connection requests are received from RDU and forwarded to the device.
For details on STUN statistics collection see, Understanding stunstatistics.log, page 11-17.
Understanding stunstatistics.log
You can monitor performance statistics by using the data recorded in the stunstatistics.log file, in which
statistics data is logged at specific intervals. By default, the time interval is set to 15 minutes.
You can configure the interval in stun.properties available under STUN_HOME/stun/conf directory. The
stunstatistics.log file resides in STUN_DATA/stun/logs/.
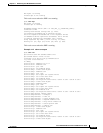
Example 11-5 Sample Logs Collected Through stunstatistics.log File
Number of Binding Request Received=40,
Number of Binding Response Sent=40,
Number of Binding Timeout Discovery Response Sent=0,
Number of Binding Update Received=60,
Number of Binding Update Authentication Succcess=25,
Number of Binding Update Authentication Failure (401-Unauthorized)=35,
Number of Binding Update Authentication Failure (420-Unknown Attribute)=0,
Number of Binding Update Authentication Failure (431-Integrity Check Failure)=0,
Number of Binding Update Authentication Failure (432-Missing Username)=0,
Number of Binding Update Authentication Failure (500-Server Error)=0,
Number of Dropped Requests (Network Failures)=0,


