


Configuration and Use Manual 33
Calibration
Startup ConfigurationCalibrationBefore You Begin
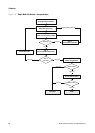
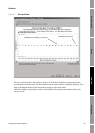
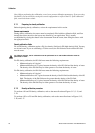
Figure 3-7 Test result chart
The test result chart shows the results for all tests in the ProLink II database, plotted against the
specification uncertainty limit. The inlet stiffness and the outlet stiffness are plotted separately. This
helps to distinguish between local and uniform changes to the sensor tubes.
This chart supports trend analysis, which can be helpful in detecting meter problems before they
become severe.
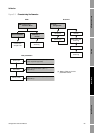
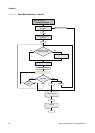
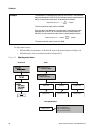
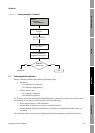
Initiated from ProLink II
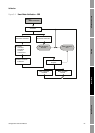
Initiated from the display or other tool