


23 Event Surveillance Viewing Events
250
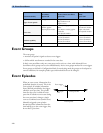
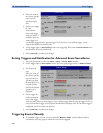
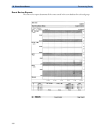
Event bars: Each event bar represents one event. The height indicates the event severity. Bars that
extend over more than one channel represent combi-events. Manually-captured events are marked with
a bar above the timeline instead of in the measurement channels.
Event values: Event information for the currently-selected event is shown on the left of the review
window. The trigger measurement is highlighted.
– If an alarm triggers the event, the monitor shows the alarm conditions that triggered the event.
– If the event trigger was user-defined, instead of an alarm condition the monitor shows for
example
SpO2 94<96, where the second number is the current event trigger threshold and the
first number is the maximum deviation from the set limit.
Trigger threshold: The horizontal lines show the trigger thresholds. Gaps in the line indicate that the
trigger was inactive for a while, possibly because alarms were switched off or because there was an
INOP condition in the group measurements.
Timeline: The timeline at the bottom indicates the period currently stored in the event database.
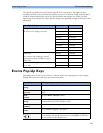
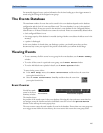
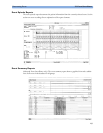
Event Episode Window
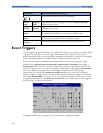
♦ To enter the Event Episode window, select the pop-up key Show Episode.
Depending on the event group settings, the
Event Episode window shows either 20 minutes of
average trend event information, four minutes of high-resolution event information, or 15 seconds of
realtime wave information.
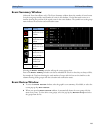
HR
Event Review
(Total: 4)
SpO2
Resp
Manual
Total
Brady
DESAT
APNEA