


About Compressed Spectral Arrays (CSA) 18 Monitoring EEG
211
About Compressed Spectral Arrays (CSA)
The continuous EEG signal is sampled periodically and this value is stored in a frame. Each frame is
processed using Fast Fourier Transformation (FFT) to provide a frequency spectrum displayed as a
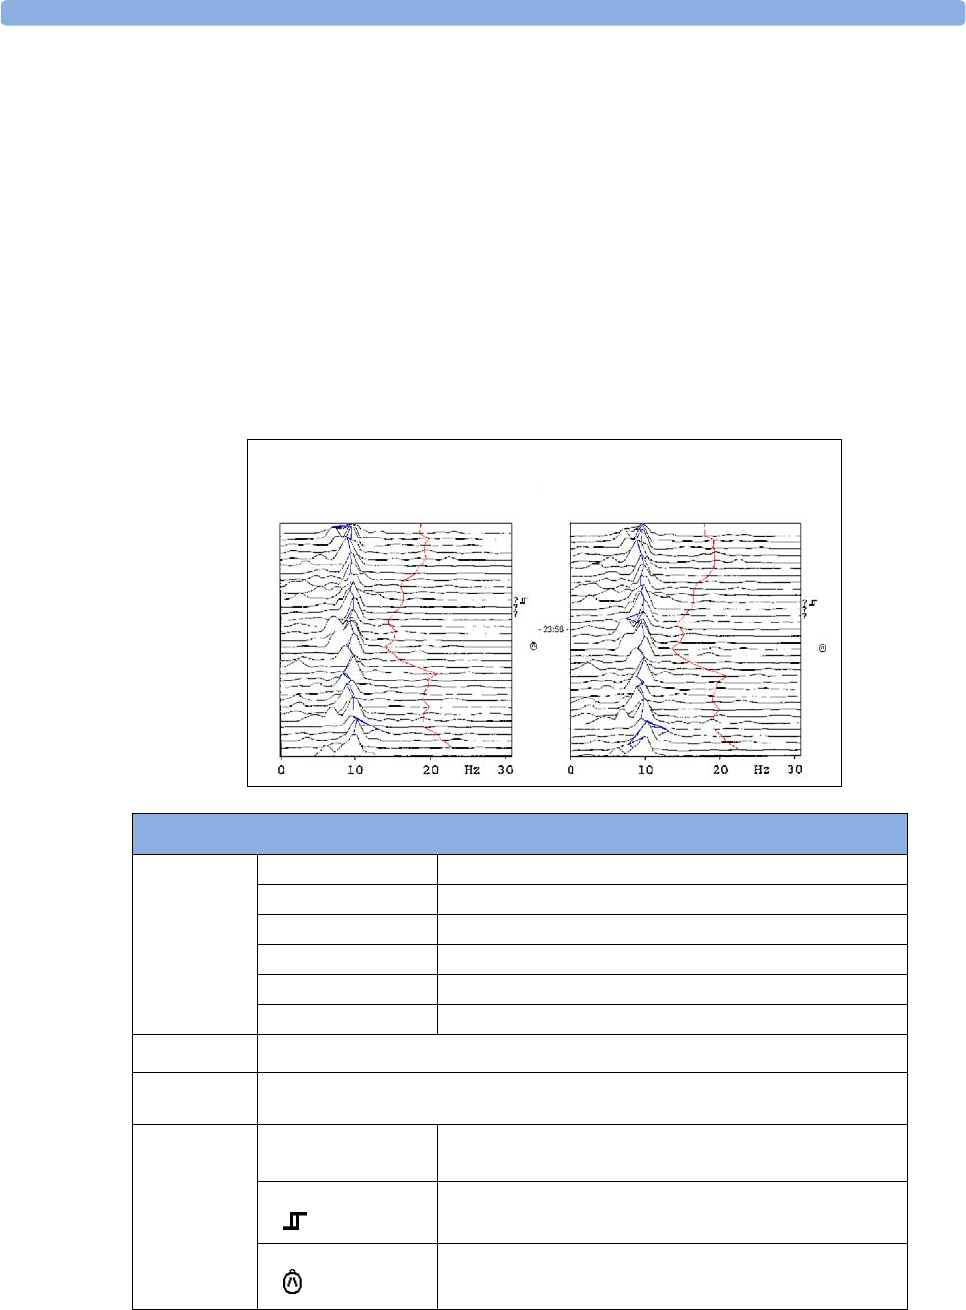
compressed spectral array (CSA).
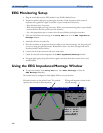
The CSA window provides an overview of the patient’s EEG values over time. It may be configured to
look slightly different on your monitor.
♦ To view the CSA window permanently embedded on a Screen, select a Screen configured to
display the CSA window.
♦ To view the CSA window over the current Screen, select the EEG CSA SmartKey, if configured, or
select Setup EEG or Main Setup then Show CSA.
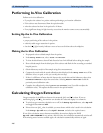
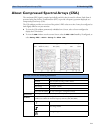
The CSA contains the following information
Status line
Lead label for example, Fp1-T3, Fp2-T4
CSA label CSA1 or CSA2 according to EEG channel
Montage label for example, Montage A
Filter settings for example, 1-30 Hz
Buffer label and time the buffer and interval between spectral lines on the CSA
Current SEF Threshold can only be changed in Configuration Mode
Spectral lines
The energy at each frequency is computed and displayed as a spectral line
Trendlines
EEG values are sampled at configured time intervals and displayed as color-coded trendlines.
Trendlines are available for the three frequency numerics (SEF, PPF, MDF)
Annotations:
INOP marker
Filter change marker
Montage change marker
Fp1-T3 Filter:0.5 - 30 Hz Montage: Montage A Fp2-T4
CSA1 Buffer: A (2 Sec) SEF (90%) PPF CSA2
?