


Fortinet 538 FortiWeb 5.0 Patch 6 Administration Guide
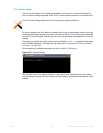
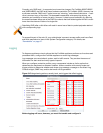
For each graph, you can select which policy’s statistics to view and the size of the interval (Rate
threshold or Time interval) represented by each appliance on the graph.
By positioning your cursor over a point in the graph, you ca
n display information for that point in
time, such as (for HTTP Traffic Monitor) the traffic volume at that point in time.
See also
• Configuring a server policy
• Configuring a pr
otection profile for inline topologies
• Configuring a protection profile for an out-of-band topology or asynchronous mode of
operation
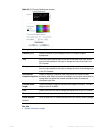
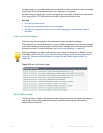
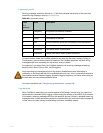
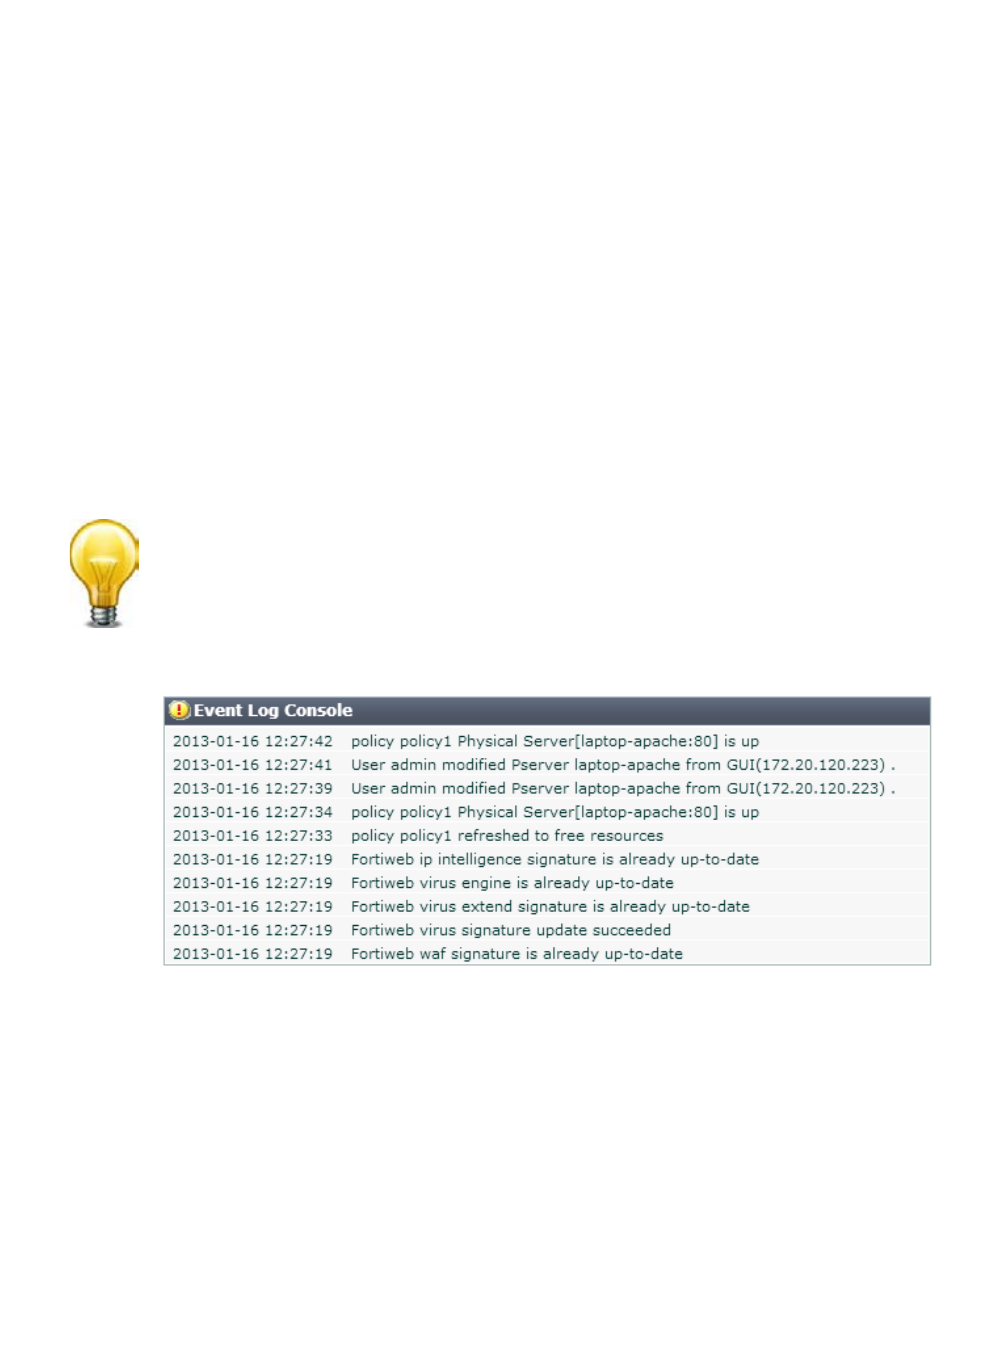
Event Log Console widget
The Event Log Console widget on the dashboard displays log-based messages.
Event logs help you track system events on your FortiWeb appliance such as firmware changes,
and ne
twork events such as changes to policies. Each message shows the date and time that
the event occurred. For more information, see “Viewing log messages” on page 557.
Figure 57:Event Log Console widget
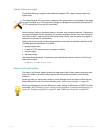
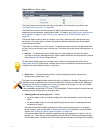
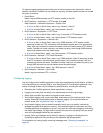
Server Status widget
The Server Status widget on the dashboard lists configured policies, the real servers (physical
and domain servers) associated with the policy, and the up/down status of the servers
associated with the policy.
Event log messages can also be delivered by email, Syslog, FortiAnalyzer, or SNMP. For more
information, see
“Enabling log types, packet payload retention, & resource shortage alerts” on
page 546, “Configuring log destinations” on page 549, and “SNMP traps & queries” on
page 580.