


Fortinet 536 FortiWeb 5.0 Patch 6 Administration Guide
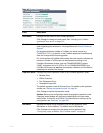
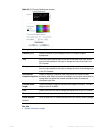
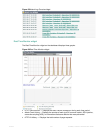
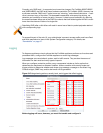
System Resources widget
The System Resources widget on the dashboard displays CPU usage, memory usage, and
system load.
Normal idle load varies by hardware platform, firmware, and configured features. To determine
your specific
baseline for idle, configure your system completely, reboot, then view the system
load. After at least 1 week of uptime with typical traffic volume, view the system load again to
determine the normal non-idle baseline.
System load is the average of percentages relative to the maximum poss
ible capability of this
FortiWeb appliance’s hardware. It includes:
• average system load
• numbe
r of HTTP daemon/proxy processes or children
• memory usage
• disk swap usage
Disk usage is not display
ed. T
o determine your available disk space, connect to the CLI and
enter the command:
diagnose system mount list
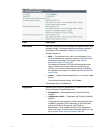
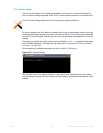
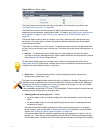
Attack Log Console widget
The Attack Log Console widget displays the latest attack logs. Attack logs are recorded when
there is an attack or intrusion attempt against the web servers protected by the FortiWeb
appliance.
Attack logs help you track policy violations. Each message shows the date and time that the
attack
attempt occurred. For more information, see “Viewing log messages” on page 557.
The widget displays CPU and memory usage as a dial gauge and as a percentage of the usage
for core processes only. CPU and memory usage for management processes (for example, for
HTTPS connections to the web UI) is excluded.
Attack log messages can also be delivered by email, Syslog, FortiAnalyzer, or SNMP. For more
information, see
“Enabling log types, packet payload retention, & resource shortage alerts” on
page 546, “Configuring logging” on page 545, and “SNMP traps & queries” on page 580.