


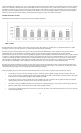
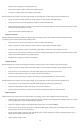
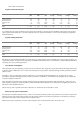

As a result of the gross margin and SG&A expense changes discussed above, our total segment contribution margin improved by $1,050 in
2003 compared to 2002 and by $3,175 in 2002 compared to 2001. See “Segment information” in note 6 of the accompanying consolidated
financial statements.
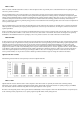
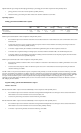
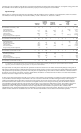
The changes in segment Management EBT are a result of the gross margin, SG&A expense and R&D expense changes discussed above. See
“Segment information” in note 6 of the accompanying consolidated financial statements for a reconciliation of segment Management EBT to
net earnings (loss) from continuing operations.
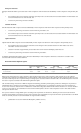
The amortization of acquired technology was $101 and $157 in 2003 and 2002, respectively, and primarily reflected the charge related to the
acquisition of Alteon WebSystems, Inc, or Alteon. The remaining net carrying value of acquired technology was fully amortized in the third
quarter of 2003.
On January 1, 2002, we adopted the provisions of SFAS No. 142, “Goodwill and Other Intangible Assets”, or SFAS 142. As a result,
amortization of goodwill, including goodwill recorded in past business combinations, and amortization of intangibles with an indefinite life
ceased upon adoption of SFAS 142.
The amortization of goodwill for 2001 primarily reflected the charges related to the acquisitions of Bay Networks, Inc., Alteon, Xros, Inc.,
Qtera Corporation, Clarify Inc. and the acquisition of JDS’s Switzerland-based subsidiary and its related assets in Poughkeepsie, New York
(also known as the 980 NPLC business).
The net carrying value of goodwill was $2,305 on December 31, 2003 and $2,199 on December 31, 2002.
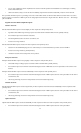
For acquisitions completed subsequent to July 1, 2000, we were required to allocate a portion of the purchase price to deferred compensation
related to unvested stock options held by employees of the acquired companies. This deferred compensation was amortized to net earnings
(loss) based on the graded vesting schedule of the stock option awards.
Deferred stock option compensation was $16 in 2003 compared to $110 in 2002 and $248 in 2001. The declines were
68
of the volume of our business.
Se
g
ment contribution mar
g
in
For the years ended December 31, 2003 vs 2002 2002 vs 2001
2003 2002 2001 $ Change % Change $ Change % Change
Wireless Networks $ 1,573 $ 1,104 $ 515 $ 469 42 $ 589 114
Enterprise Networks 560 316 263 244 77 53 20
Wireline Networks 612 736 611 (124) (17) 125 20
Optical Networks (2) (778) (1,524) 776 100 746 49
Other (341) (26) (1,688) (315) (1,212) 1,662 98
Total
$ 2,402 $ 1,352 $ (1,823) $ 1,050 78 $ 3,175 174
Se
g
ment Mana
g
ement EBT
For the
y
ears ended December 31, 2003 vs 2002 2002 vs 2001
2003 2002 2001 $ Change % Change $ Change % Change
Wireless Networks $ 695 $ 256 $ (456) $ 439 171 $ 712 156
Enterprise Networks 279 29 (141) 250 862 170 121
Wireline Networks 171 178 (205) (7) (4) 383 187
Optical Networks (260) (1,274) (2,504) 1,014 80 1,230 49
Other (306) (209) (2,634) (97) (46) 2,425 92
Total
$ 579 $ (1,020) $ (5,940) $ 1,599 157 $ 4,920 83
Amortization of intan
g
ibles
Deferred stock o
p
tion com
p
ensation