


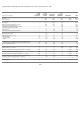
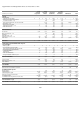
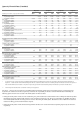


Supplemental Consolidating Balance Sheets as of December 31, 2002:
F-89
Nortel Nortel Non-
Networks Networks Guarantor Guarantor
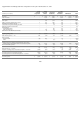
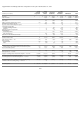
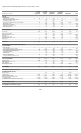
(millions of U.S. dollars) Corporation Limited Subsidiaries Subsidiaries Eliminations Total
ASSETS
Current assets
Cash and cash equivalents $ 35 $ 251 $ 2,392 $ 1,112 $ – $ 3,790
Restricted cash and cash equivalents – 6 176 67 – 249
Accounts receivable — net – 288 1,524 414 – 2,226
Intercompany/related party accounts receivable – 4,147 994 713 (5,852) 2
Inventories — net – 546 712 248 – 1,506
Income taxes recoverable 1 1 51 61 – 114
Deferred income taxes — net 12 178 615 (15) – 790
Other current assets – 146 395 109 – 650
Total current assets
48 5,563 6,859 2,709 (5,852) 9,327
Investments 5,124 1,531 (8,055) 518 1,119 237
Plant and e
q
ui
p
ment — ne
t
–
425 865 402 – 1,692
Goodwill – – 1,954 245 – 2,199
Intangible assets — net – 39 2 98 – 139
Deferred income taxes — net (26) 1,077 1,510 21 – 2,582
Other assets 36 605 1,278 395 (1,529) 785
Total assets
$ 5,182 $ 9,240 $ 4,413 $ 4,388 $ (6,262) $ 16,961
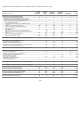
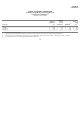
LIABILITIES AND SHAREHOLDERS’ EQUITY
Current liabilities
Notes
p
a
y
able $
–
$2$ 3$ 25$ –$30
Trade and other accounts payable – 342 391 70 – 803
Intercompany/related party accounts payable 289 110 3,052 2,401 (5,852) –
Payroll and benefit-related liabilities – 104 298 83 – 485
Contractual liabilities (1) 43 536 316 – 894
Restructuring – 78 329 100 – 507
Other accrued liabilities 41 540 2,243 433 – 3,257
Long-term debt due within one year – 174 14 55 – 243
Total current liabilities
329 1,393 6,866 3,483 (5,852) 6,219
Long-term debt 1,800 1,603 166 391 – 3,960
Deferred income taxes — net – 263 84 (10) – 337
Other liabilities – 764 2,071 1,455 (1,529) 2,761
Total liabilities
2,129 4,023 9,187 5,319 (7,381) 13,277
Minority interests in subsidiary companies – – – 95 536 631
SHAREHOLDERS’ EQUITY
Preferred shares
–
536 342 46 (924) –
Common shares 33,234 1,211 6,129 2,134 (9,474) 33,234
Additional paid-in capital 3,753 22,007 1,432 19,507 (42,946) 3,753
Deferred stock option compensation (17) – – (26) 26 (17)
Accumulated deficit (32,966) (17,596) (13,423) (22,565) 53,584 (32,966)
Accumulated other comprehensive income (loss) (951) (941) 746 (122) 317 (951)
Total shareholders’ equity
3,053 5,217 (4,774) (1,026) 583 3,053
Total liabilities and shareholders’ equity
$ 5,182 $ 9,240 $ 4,413 $ 4,388 $ (6,262) $ 16,961