


F-40
Segments
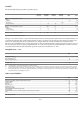
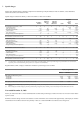
The following tables set forth information by segment for the years ended December 31:
Product revenues
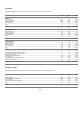
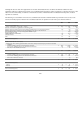
The following table sets forth external revenues by product for the years ended December 31:
2003 2002 2001
Revenues
Wireless Networks $ 4,389 $ 4,161 $ 5,699
Enterprise Networks 2,589 2,422 3,222
Wireline Networks 2,005 2,572 4,328
Optical Networks 1,179 1,820 5,050
Othe
r
31 33 601
Total $ 10,193 $ 11,008 $ 18,900
Contribution margin
Wireless Networks $ 1,573 $ 1,104 $ 515
Enterprise Networks 560 316 263
Wireline Networks 612 736 611
Optical Networks (2) (778) (1,524)
Other (341) (26) (1,688)
Total $ 2,402 $ 1,352 $ (1,823)
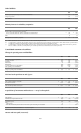
Management EBT
Wireless Networks $695 $256 $(456)
Enter
p
rise Networks 279 29 (141)
Wireline Networks 171 178 (205)
Optical Networks (260) (1,274) (2,504)
Other (306) (209) (2,634)
Total 579 (1,020) (5,940)
In-process research and development expense – – (15)
Amortization of acquired technology and other (101) (157) (806)
Amortization of goodwill – – (4,058)
Deferred stock option compensation (16) (110) (248)
Special charges (284) (2,095) (14,816)
Gain (loss) on sale of businesses and assets 421(138)
Income tax benefit (expense) 80 468 2,751
Net earnings (loss) from continuing operations $ 262 $ (2,893) $ (23,270)
2003 2002 2001
Wireless solutions $ 4,389 $ 4,161 $ 5,699
Circuit and packet voice solutions 3,044 3,193 5,224
Optical solutions 1,413 1,997 5,409
Data networking and security solutions 1,316 1,624 1,967
Other 31 33 601
Total $ 10,193 $ 11,008 $ 18,900