


half of 2003 and continued capital spending restrictions in the U.S., Canada and EMEA as customers continued to focus on maximizing return
on invested capital by increasing the capacity utilization rates and efficiency of existing networks. In Asia Pacific, optical long-haul revenues
declined substantially in 2003 compared to 2002 primarily due to the completion of network build-outs for certain customers in 2002 that were
not repeated in 2003. In addition, significant excess inventories continued to exist in this portion of the segment which resulted in ongoing
pricing pressures across all regions.
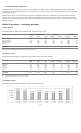
In the fourth quarter of 2002, we sold certain optical components assets to Bookham Technology plc, or Bookham. As a result, our results in
2003 in the long-haul portion of this segment do not reflect revenues generated from these assets. In 2002, revenues generated from the optical
components assets sold to Bookham were approximately 3% of the total Optical Networks revenues of $1,820.
Revenues in the metro optical portion of this segment were relatively flat in 2003 compared to 2002. This was primarily due to a substantial
decrease in EMEA partially offset by an increase in revenues in the U.S. and a substantial increase in Asia Pacific. The substantial decrease in
EMEA was primarily the result of the continued industry adjustment, tightened capital markets mainly during the first half of 2003 and
customer spending restrictions. The increase in revenues in the U.S. and the substantial increase in Asia Pacific were primarily due to new
customer contracts during the first half of 2003 for expansions of existing networks to meet increased customer demand.
From a geographic perspective, the 35% decline in Optical Networks revenues in 2003 compared to 2002 was primarily due to a:
The 64% decline in Optical Networks revenues in 2002 compared to 2001 was primarily the result of substantial reductions in capital spending
by our major U.S. and EMEA customers. These reductions were partially offset by a significant increase in Asia Pacific revenues primarily due
to new customer contracts for expansions of existing networks to meet increased customer demand.
Our major customers in the long-haul portion of this segment focused on maximizing return on invested capital by increasing the capacity
utilization rates and efficiency of existing networks. Revenues in the optical long-haul portion of the segment declined substantially in 2002
compared to 2001. The considerable decline was primarily due to the continued industry adjustment, including industry consolidation,
continued capital spending constraints and, to a lesser extent, the large redeployment of assets that occurred in 2001 and continued throughout
2002. The spending constraints and redeployment of assets were caused primarily by significant excess inventories which resulted in
significant pricing pressures.
Revenues in the metro optical portion of the segment were primarily driven by demand for enterprise connectivity and storage solutions. The
substantial decline in revenue in the metro optical portion of the segment in 2002 compared to 2001 was primarily due to a decline in demand
for mature products. This substantial decline was compounded by the ongoing industry adjustment as customers continued to focus on
optimizing existing networks and delayed the deployment of next generation products. Industry consolidation also contributed to the reduction
in service provider capital spending during 2002 and 2001. The then current generation of metro products, namely, the OPTera Metro family of
products, were the key products contributing to revenue in 2002 and accounted for a substantial portion of the overall Optical Networks
revenues. Revenue in the metro optical portion of the segment increased as a percentage of total Optical Networks revenue in 2002 compared
to 2001.
From a geographic perspective, the 64% decline in Optical Networks revenues in 2002 compared to 2001 was primarily due to a 76% decline
in revenues in U.S., a 61% decline in revenues in EMEA and a 72% decline in revenues in CALA. The declines in all these regions were
primarily due to the continued industry adjustment, including industry consolidation, capital spending constraints and the redeployment of
assets in 2001 and 2002.
62
• 35% decline in the U.S., 40% decline in EMEA and a 32% decline in Canada primarily related to a substantial reduction in capital
spending as a result of the continuing industry adjustment, tightened capital markets mainly during the first half of 2003 and
customers continuing to focus on maximizing return on invested capital; and
• 33% decline in Asia Pacific primarily related to contractual issues experienced with certain customers in the fourth quarter of 2003
and the completion of network build-outs for certain customers in the long-haul portion of this segment in 2002 that were not
repeated in 2003.
2002 vs. 2001