


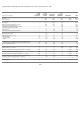
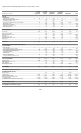
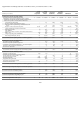


Supplemental Consolidating Statements of Cash Flows for the year ended December 31, 2001:
F-92
Nortel Nortel Non-
Networks Networks Guarantor Guarantor
(millions of U.S. dollars) Corporation Limited Subsidiaries Subsidiaries Eliminations Total
Cash flows from (used in) o
p
eratin
g
activities
Net earnings (loss) from continuing operations $ (23,255) $ (11,006) $ (12,885) $ (14,696) $ 38,572 $ (23,270)
Adjustments to reconcile net earnings (loss) from continuing
operations to net cash from (used in) operating activities, net of
effects from acquisitions and divestitures of businesses:
Amortization and depreciation – 191 2,608 2,866 – 5,665
In-process research and development expense – – – 15 – 15
Non-cash portion of special charges and related asset write
downs – 88 1,459 11,213 – 12,760
Equity in net loss of associated companies 23,220 11,171 4,744 (7) (38,978) 150
Current and deferred stock option compensation – – – 248 – 248
Deferred income taxes (3) (537) (797) (176) – (1,513)
Other liabilities – (73) 85 (21) – (9)
(Gain) loss on sale or write-down of investments and businesses – 69 253 184 – 506
Other — net (139) (458) (371) (588) 27 (1,529)
Change in operating assets and liabilities 43 522 5,227 1,391 – 7,183
Intercompany/related party activity 153 (2,539) 1,788 219 379 –
Net cash from (used in) operating activities of continuing operations 19 (2,572) 2,111 648 – 206
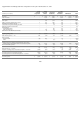
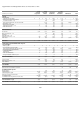
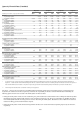
Cash flows from (used in) investing activities
Expenditures for plant and equipment – (317) (833) (152) – (1,302)
Proceeds on disposals of plant and equipment – 23 185
–
–208
Acquisitions of investments and businesses — net of cash acquired – (13) (76) 10 – (79)
Proceeds on sale of investments and businesses – 6 403 195 – 604
Investments in subsidiaries – – –
–
– –
Net cash from (used in) investing activities of continuing operations – (301) (321) 53 – (569)
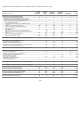
Cash flows from (used in) financing activities
Dividends on preferred shares (123) (27) –
–
27 (123)
Dividends paid by subsidiaries to minority interests – – –
–
(27) (27)
Increase (decrease) in notes payable — net – 12 (281) 39 – (230)
Proceeds from long-term debt 1,756 1,500 10 20 – 3,286
Proceeds from Paren
t
(1,800) 1,800 –
–
––
Repayments of long-term debt – (250) (12) (208) – (470)
Repayments of capital leases payable – (3) (18) (5) – (26)
Issuance of common shares 146 – –
–
– 146
Net cash from (used in) financing activities of continuing operations (21) 3,032 (301) (154) – 2,556
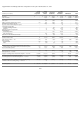
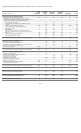
Effect of foreign exchange rate changes on cash and cash equivalents – 1 (7) (4) – (10)
Net cash from (used in) continuin
g
o
p
erations (2) 160 1,482 543 – 2,183
Net cash from (used in) discontinued operations – (108) (200) (23) – (331)
Net increase (decrease) in cash and cash equivalents (2) 52 1,282 520 – 1,852
Cash and cash equivalents at beginning of year 20 (93) 1,024 671 – 1,622
Cash and cash equivalents at end of year $ 18 $ (41) $ 2,306 $ 1,191 $ – $ 3,474