


208
Se
g
ments
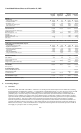
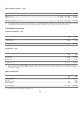
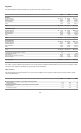
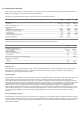
The following tables set forth information by segment for the years ended December 31:
2003 2002 2001
Revenues
Wireless Networks 214,732 164,829 202,741
Enterprise Networks 51,018 64,538 87,860
Wireline Networks 50,729 63,523 130,322
Optical Networks 21,065 40,083 136,753
Other 6,464 23,343 210,037
Total 344,008 356,316 767,713
Contribution Margin
Wireless Networks 1,361 51,869 (105,374)
Enterprise Networks 9,956 20,554 (5,786)
Wireline Networks 28,774 52,369 52,157
Optical Networks 3,989 16,728 (19,765)
Other 88,004 3,865 (6,646)
Total 132,084 145,385 (85,414)
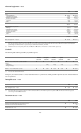
Management EBT
Wireless Networks (150,465) (289,002) (265,215)
Enterprise Networks 13,735 14,958 (13,588)
Wireline Networks 27,681 55,661 44,421
Optical Networks 8,863 14,003 (34,813)
Other (5,616) 96,164 (15,847)
Total (105,802) (108,216) (285,042)
Amortization of acquired technology and other 255 – –
Amortization of Goodwill – – 3,434
Special charges 24,563 83,427 95,379
(Gain) loss on sale of businesses and assets 13,883 16,171 (10,243)
Income tax benefit (5,614) (1,640) (34,073)
Net earnings (loss) (138,889) (206,174) (339,539)
The “Other” segment includes disposed business such as the products contributed to EADS Telecom (see note 9). These products would
mainly have been reported in the Enterprise segment prior to the contribution.
M
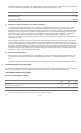
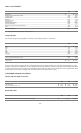
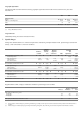
ajor customers
The following table sets forth information on revenue and receivables from two separate external customers located in France for the
years ended December 31:
2003 2002 2001
Revenues from largest customers as a percentage of external revenues:
Largest customer 23% 16% 11%
Second largest customer 23% 15% 7%
Receivables from lar
g
est customers as a
p
ercenta
g
e of external receivables
Largest customer 11% 9% 10%
Second largest customer 52% 24% 19%