


During 2004, our major customers in the optical long-haul portion of Optical Networks remained focused on maximizing return on their
invested capital by increasing the capacity utilization rates and efficiency of existing networks. We expect that any additional capital spending
by those customers in the near term will be increasingly directed to opportunities that enhance customer performance, revenue generation and
cost reduction.
We see an increase in demand for metro Dense Wavelength Division Multiplexing, or metro DWDM. This increase is primarily due to new
network deployments by certain customers and other customers expanding their networks, driven by emerging applications such as Cable
Video on Demand, all of which have resulted in a need for low cost, high capacity connectivity between network sites. As a result, we expect
that the metro optical portion of this segment will continue to represent a larger percentage of overall Optical Networks revenues. While we
have seen encouraging indicators in certain parts of the optical market, we can provide no assurance that the growth areas that have begun to
emerge will continue in the future.
Gross profit and gross margin
Gross margin improved 7.1 percentage points in 2003 compared to 2002 primarily due to:
Gross margin improved 12.8 percentage points in 2002 compared to 2001 primarily due to:
While we cannot predict the extent to which changes in product mix and pricing pressures will impact our gross margin, we continue to see the
effects of improvements in our product costs primarily due to favorable material pricing. Considering the impacts of our strategic plan
described under “Business overview — Our strategic plan and outlook” and the higher costs associated with initial customer deployments in
emerging markets, we expect that gross margin will trend in the range of 40% to 44% through 2005. See “Risk factors/forward looking
statements” for factors that may affect our gross margins.
Segment gross profit and gross margin
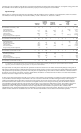
Wireless Networks gross margin improved by approximately 6 percentage points in 2003 compared to 2002 primarily due to:
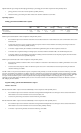
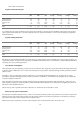
63
2004 and 2005
For the years ended December 31, 2003 vs 2002 2002 vs 2001
2003 2002 2001 Change % Change Change % Change
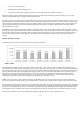
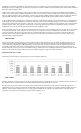
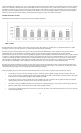
Gross profit $ 4,341 $ 3,905 $ 4,288 $ 436 11 $ (383) (9)
Gross margin 42.6% 35.5% 22.7% 7.1 pts 12.8 pts
• an increase related to continued improvements in our cost structure primarily as a result of favorable supplier pricing and changes
in product mix that resulted in increased volumes of certain products with higher margins; and
• an increase of approximately 4 percentage points related to reduced inventory provisioning and contract and customer settlement
costs. In 2003, we recorded approximately $299 of incremental inventory provisions compared to approximately $689 of similar
incremental charges in 2002; partially offset by
• pricing pressures on certain of our products; and
• an increase in expense related to our employee return to profitability, or RTP, and regular bonus plans.
• an increase of approximately 9 percentage points related to reduced inventory provisioning and contract and customer settlement
costs. In 2002, we recorded approximately $689 of incremental inventory provisions compared to approximately $1,631 of similar
incremental charges in 2001;
• improvements in our cost structure to more closely reflect our sales volume and as a result of favorable supplier pricing; partially
offset by
• pricing pressures on certain of our products.
Wireless Networks
• changes in product mix mainly related to increased volumes of certain products with higher margins;
• improvements in our product costs primarily as a result of favorable material pricing which was partially offset by