


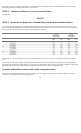


At December 31, 2003, we operated 208 sites around the world occupying approximately 13.7 million square feet. The following table sets
forth additional information regarding these sites:
At December 31, 2003, our facilities were primarily used, on a consolidated basis, approximately as follows:
In 2003, we continued to reduce the number of sites and square footage of our global facilities to better align ourselves with current market
conditions. We believe our facilities are suitable and adequate, and have sufficient capacity to meet our current needs. We continue to evaluate
our future real estate needs based on the current industry environment and taking into account our business requirements. In 2004, we
purchased land and two buildings that were previously leased by Nortel Networks. Our strategic plan announced in August and
September 2004 includes the reduction of approximately 2 million square feet of occupied space as a result of workforce reductions and
improved space utilization through the consolidation of locations. We expect the square footage reduction to be completed by the end of 2005.
For additional details, see “Special charges” in note 7 and “Long-term debt, credit and support facilities” in note 11 of the accompanying
consolidated financial statements, and “Liquidity and capital resources — Sources of liquidity” in the MD&A section of this report.
Security over substantially all of Nortel Networks Limited’s assets, including certain real estate assets in North America, became effective in
April 2002 under certain credit and security agreements entered into by Nortel Networks Limited and several of its subsidiaries. For additional
details regarding these agreements and the security, see “Long-term debt, credit and support facilities” in note 11, “Subsequent events” in note
23 and “Supplemental consolidating financial information” in note 24 of the accompanying consolidated financial statements and
“Developments in 2003 and 2004 — Credit facilities and security agreements” and “Liquidity and capital resources — Sources of liquidity —
Available support facility” in the MD&A section of this report.
24
ITEM 2. Pro
p
erties
Number of Sites
T
yp
eofSite* Owned Leased Geo
g
ra
p
hic Locations
Manufacturing and repair 8
–
All geographic regions
Distribution centers – 6 United States, Canada, EMEA and the Asia Pacific region
Offices (administration, sales and field service) 3 174 All geographic regions
Research and developmen
t
3 14 United States, Canada, EMEA and the Asia Pacific region
TOTAL** 14 194
* Indicates the primary use of the site. A number of our sites are mixed-use facilities.
** Excludes approximately 8.7 million square feet, consisting primarily of leased and/or vacant property designated as part of a planned square footage reduction in
connection with our restructuring activities commenced in 2001. At December 31, 2003 approximately 2.8 million square feet of such property was sub-leased.
• 21% by Wireless Networks;
• 12% by Enterprise Networks;
• 10% by Wireline Networks;
• 6% by Optical Networks;
• 29% by global operations; and
• 22% by one or more of our reporting segments and/or corporate facilities.