


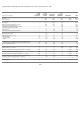
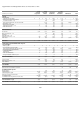
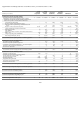
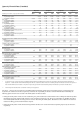


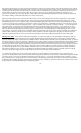

Quarterly Financial Data (Unaudited)
See notes 4, 7 and 10 to the accompanying consolidated financial statements for the impact of accounting changes, special charges and
acquisitions, divestitures and closures, respectively, that affect the comparability of the above selected financial data. Additionally, the
following significant items were recorded in the fourth quarters of 2003 and 2002:
F-93
4th Quarter 3rd Quarter 2nd Quarter 1st Quarter
(millions of U.S. dollars, except per share amounts) 2003** 2002 2003 2002 2003 2002 2003 2002
Revenues
As previously reported $2,525 $2,266 $ 2,350 $ 2,338 $ 2,788 $2,377 $2,906
As reported or restated* $ 3,266 2,616 2,344 2,322 2,285 2,920 2,298 3,150
Gross
p
rofit
As previously reported 1,029 1,192 910 1,028 1,013 1,044 819
As reported or restated* 1,434 1,109 1,130 730 882 1,029 895 1,037
Special charges
As previously reported 178 70 1,171 (2) 361 112 463
As reported or restated* 86 269 80 1,089 (22) 295 140 442
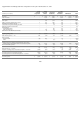
Other income (expense) — net
As previously reported 15 100 (13) 23 (23) 4 (9)
As reported or restated* 143 (34) 148 28 60 101 94 (100)
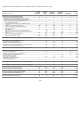
Net earnings (loss) from continuing operations
As previously reported (167) 130 (1,735) 38 (632) (171) (752)
As reported or restated* 501 (195) 88 (1,556) (93) (452) (234) (690)
Net earnin
g
s (loss) from discontinued o
p
erations
As previously reported (1) 55 2 (1) 3 190 16
As reported or restated* 27 (99) 43 5 (8) (62) 122 55
Net earnings (loss) before cumulative effect of accounting
change
As previously reported (168) 185 (1,733) 37 (629) 19 (736)
As reported or restated* 528 (294) 131 (1,551) (101) (514) (112) (635)
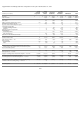
Cumulative effect of accounting change
As previously reported – –
–
– – (8)
–
As reported or restated* – – –
–
––(12)
–
Net earnings (loss)
As previously reported – (168) 185 (1,733) 37 (629) 11 (736)
As reported or restated* 528 (294) 131 (1,551) (101) (514) (124) (635)
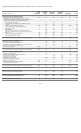
Basic earnings (loss) per common share
— from continuing operations
As previously reported (0.04) 0.03 (0.40) 0.01 (0.18) (0.04) (0.23)
As reported or restated* 0.12 (0.05) 0.02 (0.36) (0.02) (0.13) (0.06) (0.21)
— from discontinued o
p
erations
As previously reported 0.00 0.01 0.00 0.00 0.00 0.04 0.00
As reported or restated* 0.00 (0.02) 0.01 0.00 0.00 (0.02) 0.03 0.01
Basic earnings (loss) per common share
As previously reported (0.04) 0.04 (0.40) 0.01 (0.18) 0.00 (0.23)
As reported or restated* 0.12 (0.07) 0.03 (0.36) (0.02) (0.15) (0.03) (0.20)
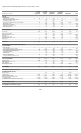
Diluted earnings (loss) per common share
— from continuing operations
As previously reported (0.04) 0.03 (0.40) 0.01 (0.18) (0.04) (0.23)
As reported or restated* 0.12 (0.05) 0.02 (0.36) (0.02) (0.13) (0.06) (0.21)
— from discontinued operations
As previously reported 0.00 0.01 0.00 0.00 0.00 0.04 0.00
As reported or restated* 0.00 (0.02) 0.01 0.00 0.00 (0.02) 0.03 0.01
Diluted earnings (loss) per common share
As previously reported (0.04) 0.04 (0.40) 0.01 (0.18) 0.00 (0.23)
As re
p
orted or restated* 0.12 (0.07) 0.03 (0.36) (0.02) (0.15) (0.03) (0.20)
* As discussed in note 3 to the accompanying consolidated financial statements and Management’s Discussions and Analysis of Financial Condition and Results of
Operations — Nortel Networks Audit Committee Independent Review; restatements; related matters, the unaudited quarterly financial data for the first three quarters of
2003 and all of 2002 have been restated. A comparison of previously reported and restated unaudited quarterly financial data is presented in the tables above.
** The fourth quarter ended December 31, 2003 had not been previously reported.
• During the fourth quarter of 2003, revenue of $300 and gross profit of $186 was recorded related to sales of Enterprise Networks products
that had been previously deferred until software revenue recognition criteria were met. The gross profit impact was partially offset by an
incremental Optical Networks inventory provision of $119. Also during the fourth quarter, bad debt recoveries of $69 were recorded as a
reduction to selling, general and administrative expense.
• During the fourth quarter of 2002, bonus and fringe benefit estimates were revised which reduced operating expenses by $33 and $101,
respectively.