B - Glossary
78
Template Files
Template files contain test-setup data that may be used in multiple tests. By eliminating a portion of the
setup task, using template files can streamline the test process. Template information is included with the
test data when the test is run. At the beginning of each test you can elect to use an existing template file
when running your test, or you can create a new template for the test by entering new setup information
in the Main and Test Setup screens. You may also choose not to use template files and enter entirely new
information when setting up a test.
Integration Period
The integration period specifies the time during which instantaneous flicker values are accumulated for
subsequent evaluation as short-term flicker or Pst. The integration period is determined by the selected
Pst integration time. The Pst integration time can be specified as 1, 5, 10, or 15 minutes. The resulting
time (total test time) equals the number of integration periods multiplied by the Pst integration time. For
example if the Pst integration time is specified as 10 minutes, and 12 integration periods have been
selected, the total time of the test will be 2 hours.
Data Records
The number of data records acquired by the Agilent 14761A application. Records are numbered
sequentially beginning with one at the start of each test. The number of completed data records may be
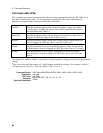
displayed in the status bar on the bottom of the screen. Data records contain the following information:
For Quasi-stationary or Fluctuating harmonics
ñ Each Rectangular-window record contains data from 16 cycles of the fundamental frequency at
50 and 60 Hz. 40 current harmonic values, rms current, rms voltage, and real power is calculated
for each data record.
ñ Each Hanning-window record contains data from 24 cycles of the fundamental frequency at 50
Hz, and data from 32 cycles of the fundamental frequency at 60 Hz. 40 current harmonic values,
rms current, rms voltage, and real power is calculated for each data record.
For Voltage Fluctuations
ñ Each Rms/Instantaneous Flicker record contains rms data and instantaneous flicker data acquired
at a rate of one record per second. Each Rms voltage record contains 100 data points at 50 Hz
(120 data points at 60 Hz), integrated over half-cycle periods. Each Instantaneous Flicker record
contains 100 data points at 50 Hz (120 data points at 60 Hz), sampled once every 10 ms at 50 Hz
(once every 8.33 ms at 60 Hz).
ñ Each Pst/Probability/Distribution data record contains “time-at-level” occurrences for
instantaneous flicker data acquired during one integration period (which may be specified as 1, 5,
10, or 15 minutes in length). The data is accumulated into 1024 logarithmically scaled bins,
which are log-weighted by flicker level in the range of 0.01 to 10000 perceptibility units. Based
on this data, Pst values are calculated for each integration period.
Watch Events
Watch events are test parameters that you can specify to trigger the termination of the test. Watch events
may or may not result in failures. For example, when testing Quasi-stationary Harmonics, you may
configure the test to terminate when a specific harmonic approaches 95% of the regulation. In this way
you can examine the test results that existed at the time the test terminated.


