


Viewing Test Data - 5
39
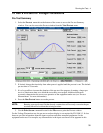
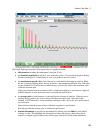
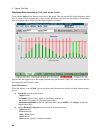
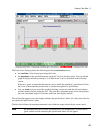
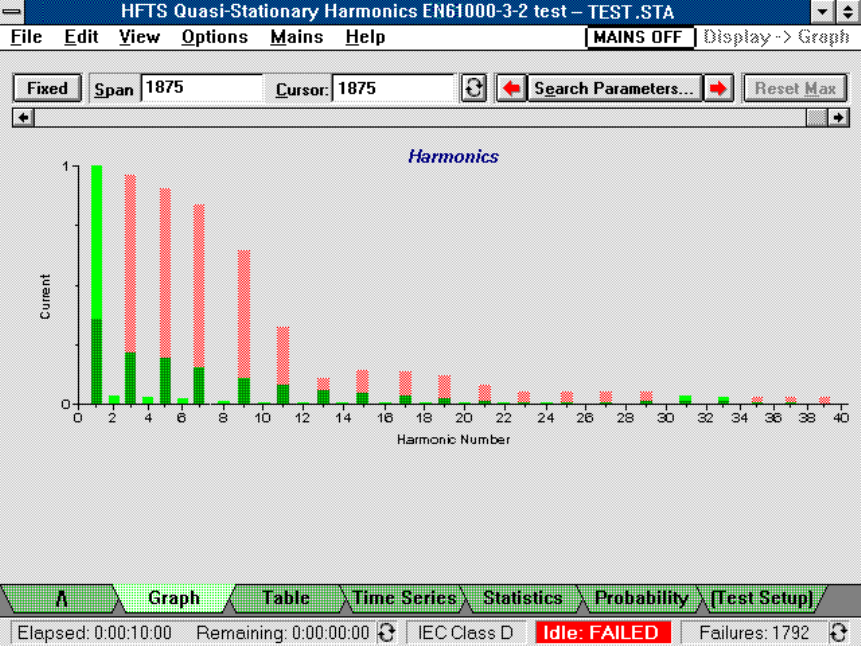
The Graph display presents the following test data in a graphical format:
ñ 40 harmonics including the fundamental, along the X axis.
ñ the harmonic magnitude along the Y axis in absolute values. You can edit the graph to display
the data according to % of limit on the Y-axis as described in the next section.
ñ the maximum measured value of each harmonic is indicated by the height of each bar. When
the test is running (Rolling mode), the top of the bar is the maximum peak-hold value. When the
test has finished or if Fixed mode is selected during a test run, this value is the maximum value
within the selected span.
Light green indicates that the maximum value is within the regulation’s specification. Light red
indicates that one or more measured values are outside the specification.
ñ the present value of each harmonic is indicated by the solid part of each bar. When the test is
running (Rolling mode), this value is always the latest measured value. After the test has
finished, or if Fixed mode is selected during a running test, this value is the value at the present
cursor location.
Green indicates that the present value is within the regulation’s specification.
Red indicates that the present value is outside the specification.
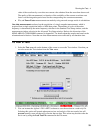
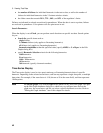
ñ detailed information on any bar can be obtained by holding down the Shift key and double-
clicking on a bar. This highlights the selected bar in white and puts up a dialog box which
displays a complete report of data points, failure types, and errors for the selected harmonic.