


65
6
Searching for Specific Test Data
The toolbar on top of the display screen, which is referred to as the Navigator toolbar and is described in the
beginning of chapter 5, is used to search for specific data in the test record. There are two ways to search for
specific test data.
Searching for Data While the Test is Running
Using the Navigator toolbar while the test is running may prove to be slow unless you have a very fast PC with
lots of memory. This is caused by the constant processing of incoming data from your Agilent 6800-Series AC
Power Source/Analyzer. If this processing proves to be too slow on your PC, you may choose to wait until
after the test has completed before using the Navigator toolbar.
1. Click on the Rolling button to stop updating the display. Clicking on “Rolling” changes the button to
“Fixed”.
2. Search for specific data by one of the following methods:
ñ Click on the Search Parameters button. Select a specific item to search for in the dialog box that
appears on the screen and click OK. Use the red
and ® buttons to search either direction in time
for the specified item.
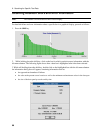
ñ For the Harmonics graph and table displays, the Pst display, the Probability display, and the
Distribution display, e
nter a span and a cursor location to examine the portion of the test record
that is of interest.
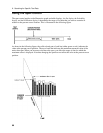
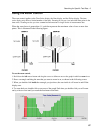
ñ For the Time Series, Rms, and Flicker displays, hold down the left mouse button to zoom in on a
specific area of the graph
(see Using the Zoom Control).
3. Click on the Fixed button to return the display to “Rolling“, where it resumes being updated with the latest
data.
Searching for Data After the Test has Completed
Search for specific data by one of the following methods:
ñ Click on the Search Parameters button. Select a specific item to search for in the dialog box that
appears on the screen and click OK. Use the red
and ® buttons to search either direction in time
for the specified item.
ñ For the Harmonics graph and table displays, the Pst display, the Probability display, and the
Distribution display, e
nter a span and a cursor location to examine the portion of the test record
that is of interest.
ñ For the Time Series, Rms, and Flicker displays, hold down the left mouse button to zoom in on a
specific area of the graph
(see Using the Zoom Control).