


6 - Searching for Specific Test Data
66
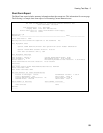
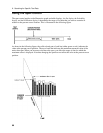
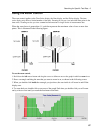
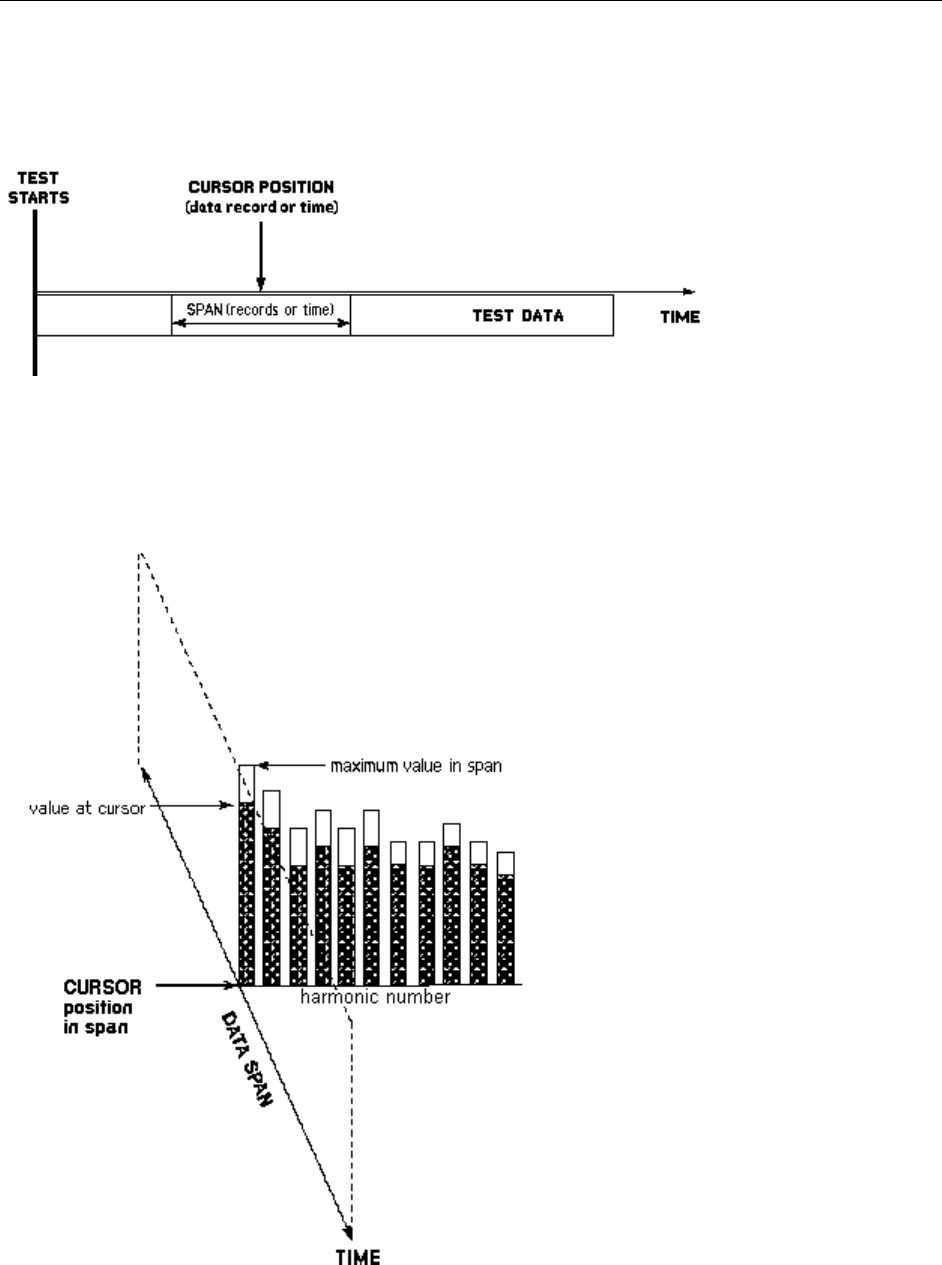
Using the Span Control
The span control applies to the Harmonics graph and table displays, the Pst display, the Probability
display, and the Distribution display. It
determines the range of test data that you want to examine in
relation to the present cursor location. This is illustrated in the following figure.
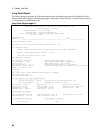
As shown in the following figure, the solid-colored part of each bar (either green or red), indicates the
value at the present cursor position. The top of each bar indicates the maximum measured value of the
entire data span. When you increase or decrease the span, you affect the range of data for which the
maximum value is displayed. Note that changing the span does not affect the value at the present cursor
position.