


4 - Running the Test
32
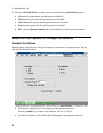
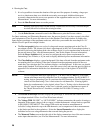
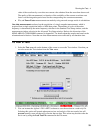
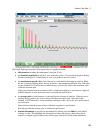
display. The tabular data displayed in this window provides a permanent record of the test conditions that
existed at the time of the voltage fluctuations test.
ñ The Measured Values area on the right side of the display provide a record of the test conditions
at the time the voltage fluctuations pre-test was run.
ñ The Output Impedance of the Harmonic/ Flicker Test System is automatically set to the
requirements of IEC 1000-3-3 when testing for Voltage fluctuations. For 230 V/50 Hz power
distribution systems, the reference value is 0.4 + j 0.25 Ω (lumped phase and neutral per IEC
725). This corresponds to 796 µH for the inductive component.
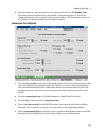
NOTE: The output impedance is set to a minimum during the pre-test. This is done to permit
evaluation of ac source performance under the worst-case loading condition possible for
the equipment under test.
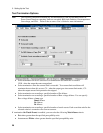
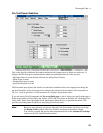
Pre-test Measurements
Pre-test measurement data is collected using the following measurement processes:
Measurement Method Measurement Method
Rms voltage
Rms
Power factor
Watts/VA
Frequency
One-shot
Voltage THD
One-shot
Rms current
Rms
Current THD
One-shot
Peak Current
Estimated
Voltage harmonics
Peak
Real power
Average
Current waveform
One-shot
Apparent power
Vrms x Irms
Average, rms, and peak measurements are based on a long-term acquisition process that is
determined by the duration time specified in the Pre-test window. Varying the test duration time
increases the amount of data upon which the measurements are based.
ñ Average measurements are made by acquiring N measurements, totaling the acquired values, and
multiplying by 1/N.
ñ Rms measurements are made by acquiring N measurements, totaling the square of the values,
multiplying by 1/N, and then taking the square root. Vrms and Irms values returned with the pre-
test data are used to calculate Vrms and Irms over integration periods specified by the pre-test
duration control.
ñ Peak method measurements are made by returning the highest value obtained during the
specified integration period.
ñ Voltage THD is calculated by:
()
THD
n
Max harmonic
nto
rms
V
=
=
∑
2
240
100
_
*
For voltage harmonics, this is the highest rms value encountered during the pre-test for each
individual voltage harmonic.
ñ The Estimated peak current measurement is implemented by multiplying the integrated Irms
value by the crest factor of the current waveform. Crest factor is calculated by dividing the peak