


5 - Viewing Test Data
38
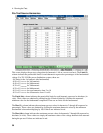
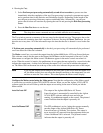
Search
Parameters
This control is only active when the display is set to Fixed. It puts up a dialog
box that lets you search for specific items in the test data that you are presently
viewing. Clicking on the red button initiates a search backward in time from
the present cursor location. Clicking on the red ® button initiates a search
forward in time from the present cursor location.
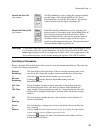
Reset Max
This control only applies to the harmonic Graph and Table displays. It is only
active when the display is set to Rolling. It resets the maximum values in the
Graph and Table displays to the to the present value, which eliminates any
previous peak hold settings.
Note that this button only affects the display; it does not change any of the test
data that is being stored in the database by the present test.
Scroll Bar
The scroll bar is only active when the display is set to Fixed. It lets you access
all of the data in the test. Clicking on the black and ® buttons slides the scroll
button through the data. Each time the and ® buttons are clicked, the
cursor moves one data record. You can also click on the scroll bar to move the
button through the data, or drag the button directly. Each time the scroll bar is
clicked, the cursor moves one span width.
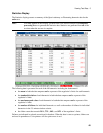
For Quasi-stationary or Fluctuating harmonic tests, the following data display formats are available:
Graph, Table, Time-Series, Statistics, and Probability. Information appears in the Statistics and
Probability windows only after the test has completed and post processing has been performed.
For Voltage Fluctuations tests, the following data display formats are available: Pst, Probability,
Distribution, RMS, and Flicker. Data in the Pst, Probability, and Distribution windows is updated only
at the end of each integration period or at the end of the test.
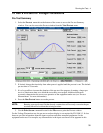
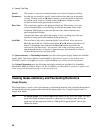
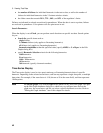
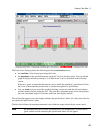
Viewing Quasi-stationary and Fluctuating Harmonics
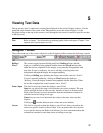
Graph Display
The Graph display is used to view quasi-stationary or fluctuating harmonic data. Note that the amount of
test data displayed in the graph may be limited by the Span control. See “Using the Span Control” in
chapter 6 for details.
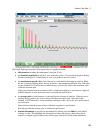
Note To edit the graph, click with the right mouse button on any area of the graph. This puts
up the Edit Graph Attributes dialog box, which lets you configure items such as the
graph axes and the graph span. Refer to “Editing the Graph Attributes” later in this
chapter for details.