


Viewing Test Data - 5
51
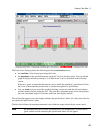
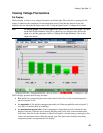
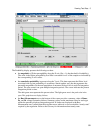
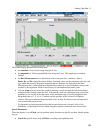
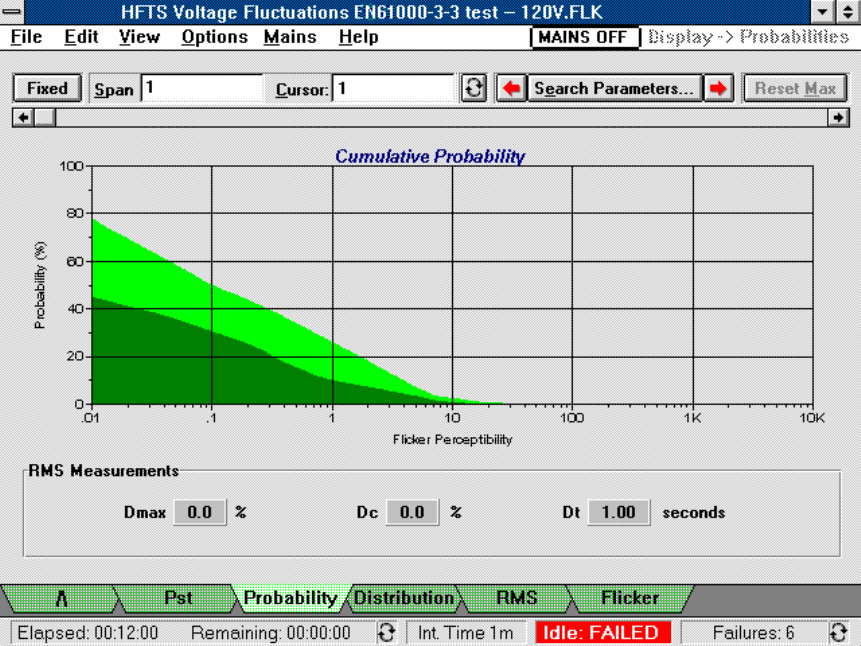
The Probability display presents the following test data:
ñ the magnitude of flicker perceptibility along the X axis (Pst = 1 is the threshold of irritability).
The value is the flicker perceptibility level that is exceeded for x% of the samples as indicated by
the corresponding Y-axis values.
ñ the cumulative probability in percent along the Y axis. This data represents the flicker level
associated with a given probability of occurrence. Stated another way, the data represents the
percentile magnitudes for the total population of measured flicker levels in each Pst integration
period. The span control can span multiple integration periods. The cursor indicates the present
integration period or time.
The dark green area represents the present value. The light green area is
the peak value in the
span. This graph does not display failures.
ñ the Rms Measurement area on the bottom of the screen provides a summary value of Dmax,
Dc, and Dt voltage fluctuation failures. Summary values are the maximum value for each type
within the presently displayed integration period. If dashes are displayed in the Rms
Measurement area, it means that the test either never achieved or never exited the “steady-state”
required by the regulation. Refer to the Glossary for information about steady-state.