


1 - Introduction
10
EN 61000-3-3 Regulation
EN 61000-3-3 regulates the magnitude, rate, and time-duration of voltage fluctuations and flicker
caused by products connected to the ac line. Voltage fluctuations are created by time-varying current
drains working against branch circuit impedance that exists in all power distribution networks. Flicker
occurs when an incandescent lamp changes in intensity due to the frequency and amplitude of voltage
fluctuations in the same branch circuit.
Because flicker is annoying, and for certain individuals presents a health hazard, the regulation seeks to
regulate flicker generation to an imperceptible level. A specialized instrument called a flickermeter,
which is built into the Agilent 6800-Series AC Power Source/Analyzer, is used to measure flicker in
terms of human perceptibility. A perceptibility level of 1 represents the threshold of perception for the
average individual.
Note that the EN 60555-3 (IEC 555-3) regulation is no longer a requirement and has officially been
replaced by EN 61000-3-3.
Compliance Testing Implementation
The Agilent 14761A HFTS software compliance tests to EN 61000-3-3 as follows:
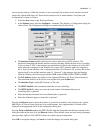
ñ It initializes and programs the Agilent 6800-Series AC Power Source/Analyzer.
ñ After the pre-test, the software shows one cycle of voltage and current, which represents the
average of all half-cycle measurements made during the pre-test, with Class D envelope
information superimposed over the waveshapes. Note that the envelope waveshape is provided
for information only, the regulation does not require Equipment Under Test (EUT)
classification. Therefore, no Percent in Envelope information or Volt THD IN SPEC/OUT of
SPEC information is provided. However, information about rms voltage, frequency, rms current,
peak current, real power, apparent power, power factor, voltage distortion, and current distortion
is provided.
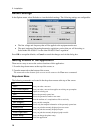
ñ When the compliance test is run, the software generates a bar graph which displays the short-
term flicker (Pst) compared to the predetermined test limits at the end of each integration period.
The graph shows the maximum measured value and the present value .
ñ During the compliance test, the software produces a bar graph that displays the selected time
range of rms voltage values. This graph effectively shows the time-series of rms voltage
variations produced by the varying load currents flowing through the reference impedance.
ñ Probability and distribution graphs reflect a statistical view of the raw data used to generate the
Pst graph at the end of each integration period. Note that long term flicker (Plt) data is generated
during post processing after the test has completed . This information is included in the long
form report.
ñ Summary values for maximum rms voltage deviation (Dmax), steady-state voltage change (Dc),
and the time interval during which the voltage deviation exceeds the prescribed limit (Dt), are
displayed at the bottom of each display. These are the maximum values for each parameter
within the presently displayed integration period.
ñ The software also displays the time-series for instantaneous flicker, which can be useful for
diagnosing faults in the equipment under test.