


Viewing Test Data - 5
41
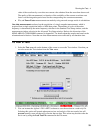
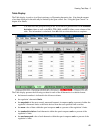
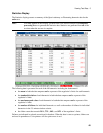
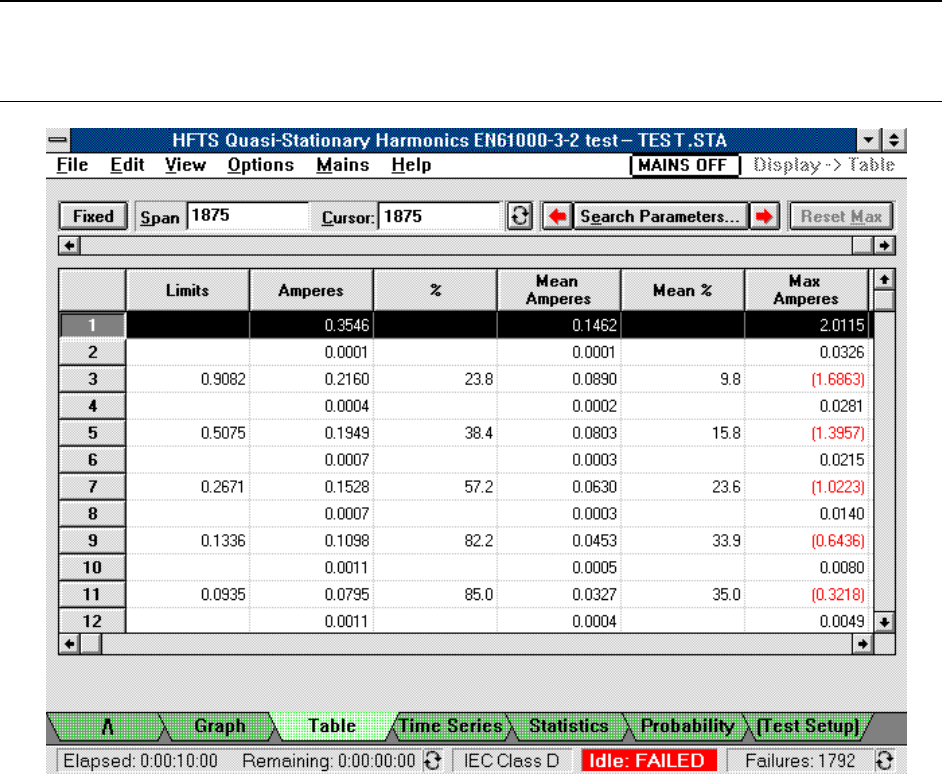
Table Display
The Table display is used to view Quasi-stationary or Fluctuating harmonic data. Note that the amount
of test data displayed in the table may be limited by the Span control. See “Using the Span Control” in
chapter 6 for details.
Note: You must have run post-processing in the Test window to generate data for the standard
deviation column as well as the 50%, 75%, 90%, and 95% failure count columns of the
table. This information is calculated from all of the test data after the test completes.
The Table display presents the following test data for each of the 40 harmonics in a tabular format:
ñ the harmonic number is indicated in the left-most column.
ñ the regulation’s harmonic limits.
ñ the magnitude of the most recently measured harmonic in amperes and as a percent of either the
regulation’s harmonic limits or the limits derived from the user-specified limit overrides.
ñ the mean value of data within the span in amperes and as a percent of the regulation’s limits.
ñ the standard deviation of each harmonic within the span in amperes and as a percent of the
regulation’s limits.
ñ the maximum peak value of each harmonic within the span in amperes and as a percent of the
regulation’s limits.