


Viewing Test Data - 5
49
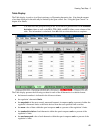
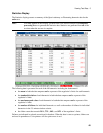
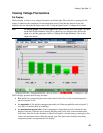
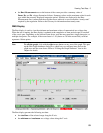
Viewing Voltage Fluctuations
Pst Display
The Pst display is used to view voltage fluctuations and flicker data. When the test is running, the Pst
display is updated at the completion of each integration period. Note that the amount of test data
displayed may be limited by the Span control. See “Using the Span Control” in chapter 6 for details.
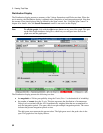
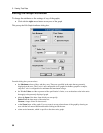
Note To edit the graph, click with the right mouse button on any area of the graph. This puts
up the Edit Graph Attributes dialog box, which lets you configure items such as the
graph axes and the graph span. Refer to “Editing the Graph Attributes” later in this
chapter for details.
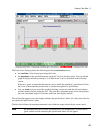
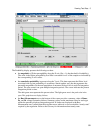
The Pst display presents the following test data:
ñ Pst, and the five component percentile values used to derive Pst, for the selected integration
period along the X axis.
ñ the magnitude of Pst and the component percentiles in flicker perceptibility units along the Y
axis (Pst=1 is the threshold of irritability)
ñ the maximum measured value of each component by integration period is indicated by the
height of each bar. When the test is running (Rolling mode), this value is the maximum peak-
hold value. After the test has finished, or when Fixed mode is selected during a running test, this
value is the maximum value within the selected span. The span control indicates how many
integration periods are represented in the display.