


5 - Viewing Test Data
54
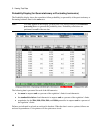
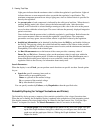
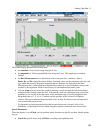
A green bar means that all values summarized by the bar are within the regulation’s
specification. A red bar means that one or more values summarized by the bar are outside the
regulation’s specification.
ñ detailed rms information can be obtained by holding down the Shift key and double-clicking
on a bar. This highlights the selected bar in white and puts up a dialog box which displays a
report of the Dc failures, Dmax failures, or Dt failures represented by the bar. The minimum and
maximum rms voltage is also given.
ñ the Rms Measurement area on the bottom of the screen provides a summary value of
Dmax, Dc, and Dt failures. Summary values are the maximum value for each type within the
presently displayed integration period. If dashes are displayed in the Rms Measurement area, it
means that the test either never achieved or never exited the “steady-state” required by the
regulation. Refer to the Glossary for information about steady-state.
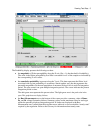
ñ You can zoom in on any area of the graph by drawing a zoom area with the left mouse button
and then double-clicking inside the area. Zoom factors are incremented in steps of five’s, for
example 1, 5, 10, and so on. Note that the zoom has a minimum range of one data point/bar (or
one second of the total span), and a maximum range of one Pst integration time. Integration times
of 1, 5, 10, or 15 minutes can be specified in the Advance Test Options window before the test is
run. The cursor indicates the present data record or time. Each data record corresponds to one
second of the total test time.
To determine in which integration period the present data record is located, click on Pst,
Probability, or Distribution and see which integration period is indicated in the Cursor field.
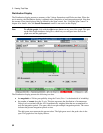
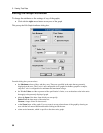
Search Parameters
When the display is set to Fixed, you can perform search functions on specific test data. Search options
let you:
ñ Search for specific items such as:
Dmax failures as a percent of the nominal voltage
Dc failures as a percent of the nominal voltage
Dt failures by time threshold
Any failures.
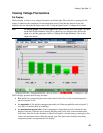
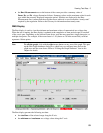
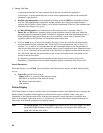
Flicker Display
The Flicker display is used to view the values of instantaneous flicker data. When the test is running, the
Flicker display is updated at the completion of time periods equal to one half of the x-axis span.
Depending on the selected zoom factor, each bar may represent a single data point, or multiple data
points. For example, if the zoom factor is 1:10 (shown as 10 in the zoom field), each bar represents 10
data points. Note that this graph does not display failures.
Note To edit the graph, click with the right mouse button on any area of the graph. This puts
up the Edit Graph Attributes dialog box, which lets you configure items such as the
graph axes and the zoom factor.